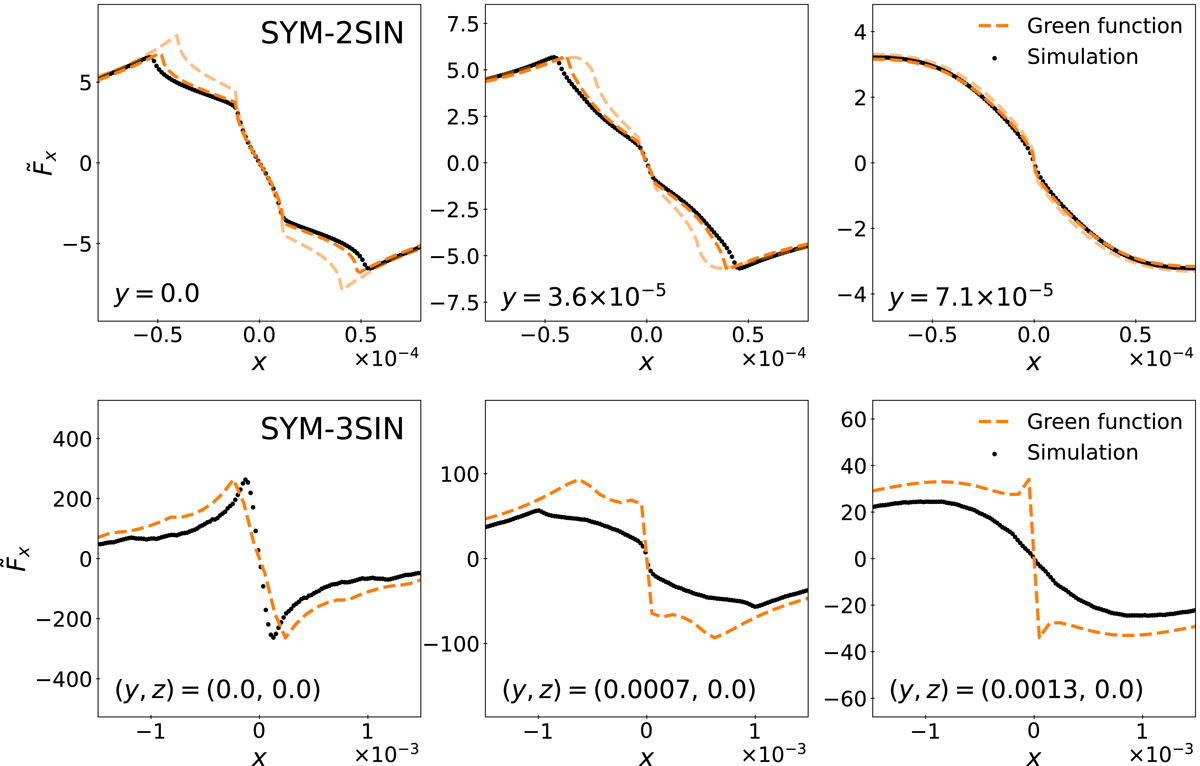
Fig. 7.
Download original image
Same as Fig. 5 but for the SYM-2SIN (top panels) and SYM-3SIN (bottom panels) initial conditions and the fact that there are no blue or green curves, because our analytical recipes apply only to shell crossing occurring along one direction. Only the x component of the force is shown in Fig. 7 due to the symmetric nature of the system. In addition, the 15LPT prediction from Eq. (14) is shown as a dashed light orange curve in the 2D case.
Current usage metrics show cumulative count of Article Views (full-text article views including HTML views, PDF and ePub downloads, according to the available data) and Abstracts Views on Vision4Press platform.
Data correspond to usage on the plateform after 2015. The current usage metrics is available 48-96 hours after online publication and is updated daily on week days.
Initial download of the metrics may take a while.