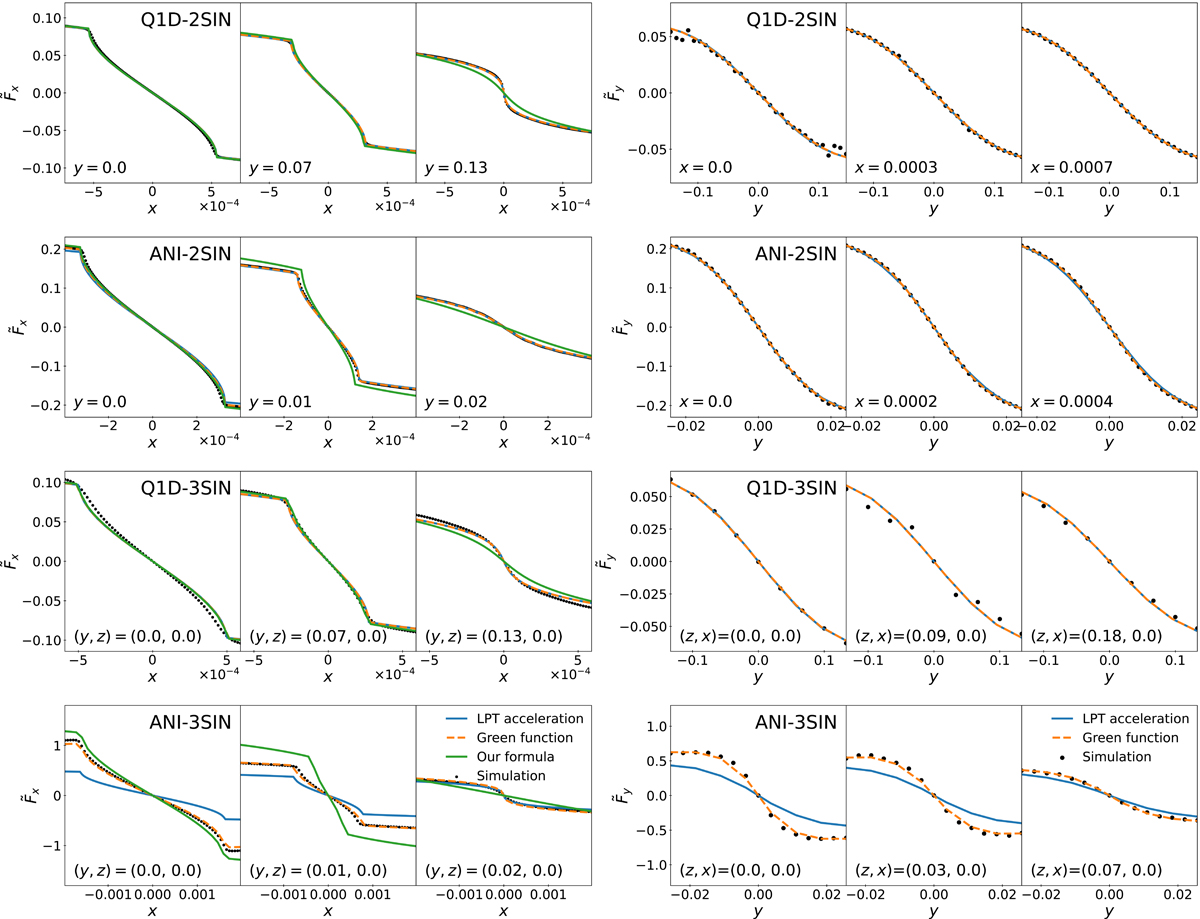
Fig. 5.
Download original image
Comparison between simulations and analytical predictions for Fx (left panels) and Fy (right panels) slightly beyond first shell-crossing time. From top to bottom, we consider Q1D-2SIN, ANI-2SIN, Q1D-3SIN, and ANI-3SIN initial conditions, respectively. For each initial condition, we present the force for three different values of y and/or z, as indicated in each panel. The largest values of y and z are outside the multi-stream region. The dots stand for the measurements in the ColDICE simulations. The solid green curves in the left panels give the theoretical prediction for Fx from the analytical formula (51). The solid blue lines correspond to the theoretical predictions for Fx and Fy obtained from the LPT acceleration using Eq. (49) (only in the multi-stream region) and Eq. (15), respectively. The dashed orange lines represent the force field resulting from solving the Poisson Eq. (14), when using the LPT displacement instead of the supposedly exact positions of particles in the ColDICE runs.
Current usage metrics show cumulative count of Article Views (full-text article views including HTML views, PDF and ePub downloads, according to the available data) and Abstracts Views on Vision4Press platform.
Data correspond to usage on the plateform after 2015. The current usage metrics is available 48-96 hours after online publication and is updated daily on week days.
Initial download of the metrics may take a while.