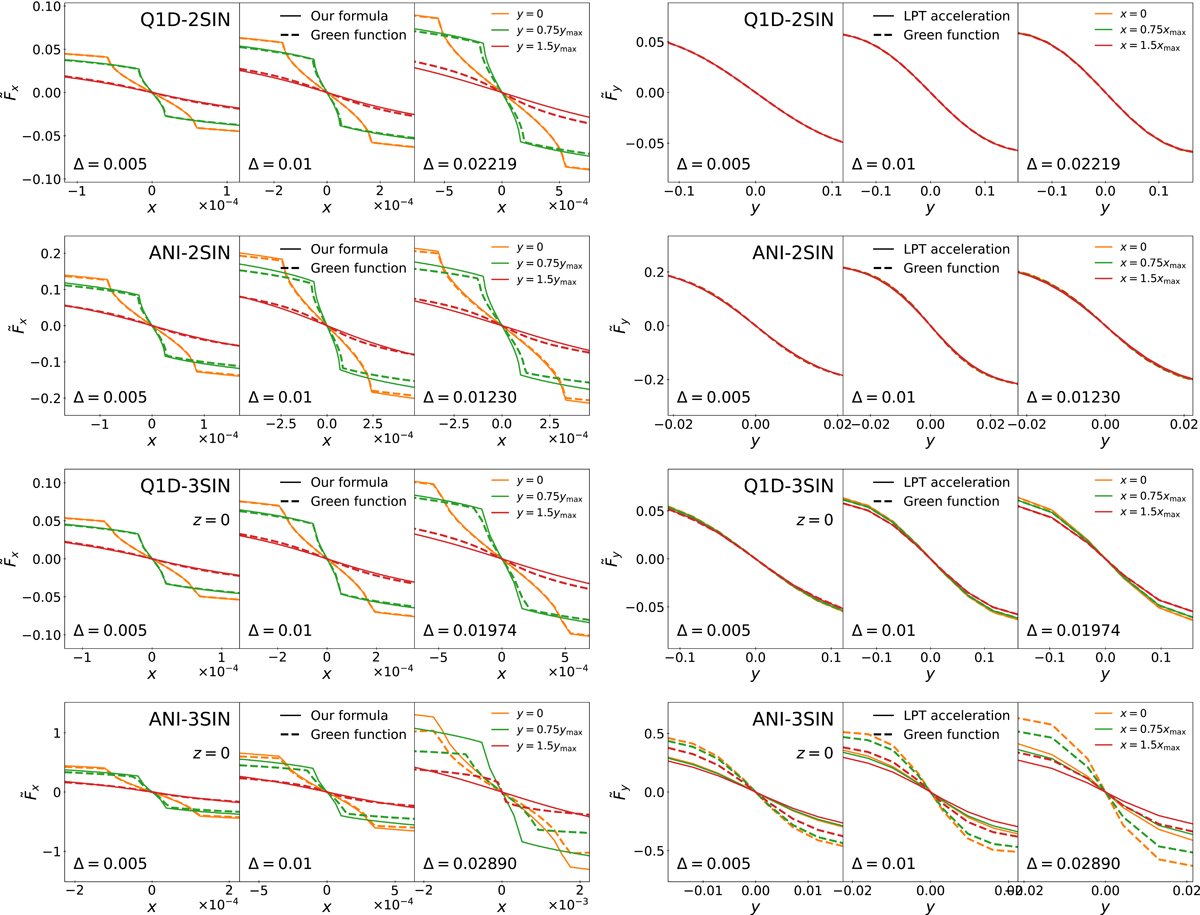
Fig. 4.
Download original image
Time dependence of the x and y components of the force for the various initial sine wave conditions considered in this article, as indicated in the panels. In each row, the output time, traced by the parameter Δ in Eq. (53), increases from left to right, as indicated in each panel, with ![]() in the right panels, where Δsim corresponds to the output time in the simulations discussed in Sect. 5 (see also Table 1). Note that in this last case, the value indicated in the figure is not Δ but Δsim, but the differences are small. The exact solution given by Eq. (14) applied to the LPT displacement (dashes) is compared to the analytical formula (51) for Fx and with the LPT acceleration (15) for Fy (solid lines). The two top and two bottom rows use 40LPT and 15LPT, respectively, to compute the displacement field and its acceleration. In the two bottom rows, we assume z = 0.
in the right panels, where Δsim corresponds to the output time in the simulations discussed in Sect. 5 (see also Table 1). Note that in this last case, the value indicated in the figure is not Δ but Δsim, but the differences are small. The exact solution given by Eq. (14) applied to the LPT displacement (dashes) is compared to the analytical formula (51) for Fx and with the LPT acceleration (15) for Fy (solid lines). The two top and two bottom rows use 40LPT and 15LPT, respectively, to compute the displacement field and its acceleration. In the two bottom rows, we assume z = 0.
Current usage metrics show cumulative count of Article Views (full-text article views including HTML views, PDF and ePub downloads, according to the available data) and Abstracts Views on Vision4Press platform.
Data correspond to usage on the plateform after 2015. The current usage metrics is available 48-96 hours after online publication and is updated daily on week days.
Initial download of the metrics may take a while.