Fig. 3.
Download original image
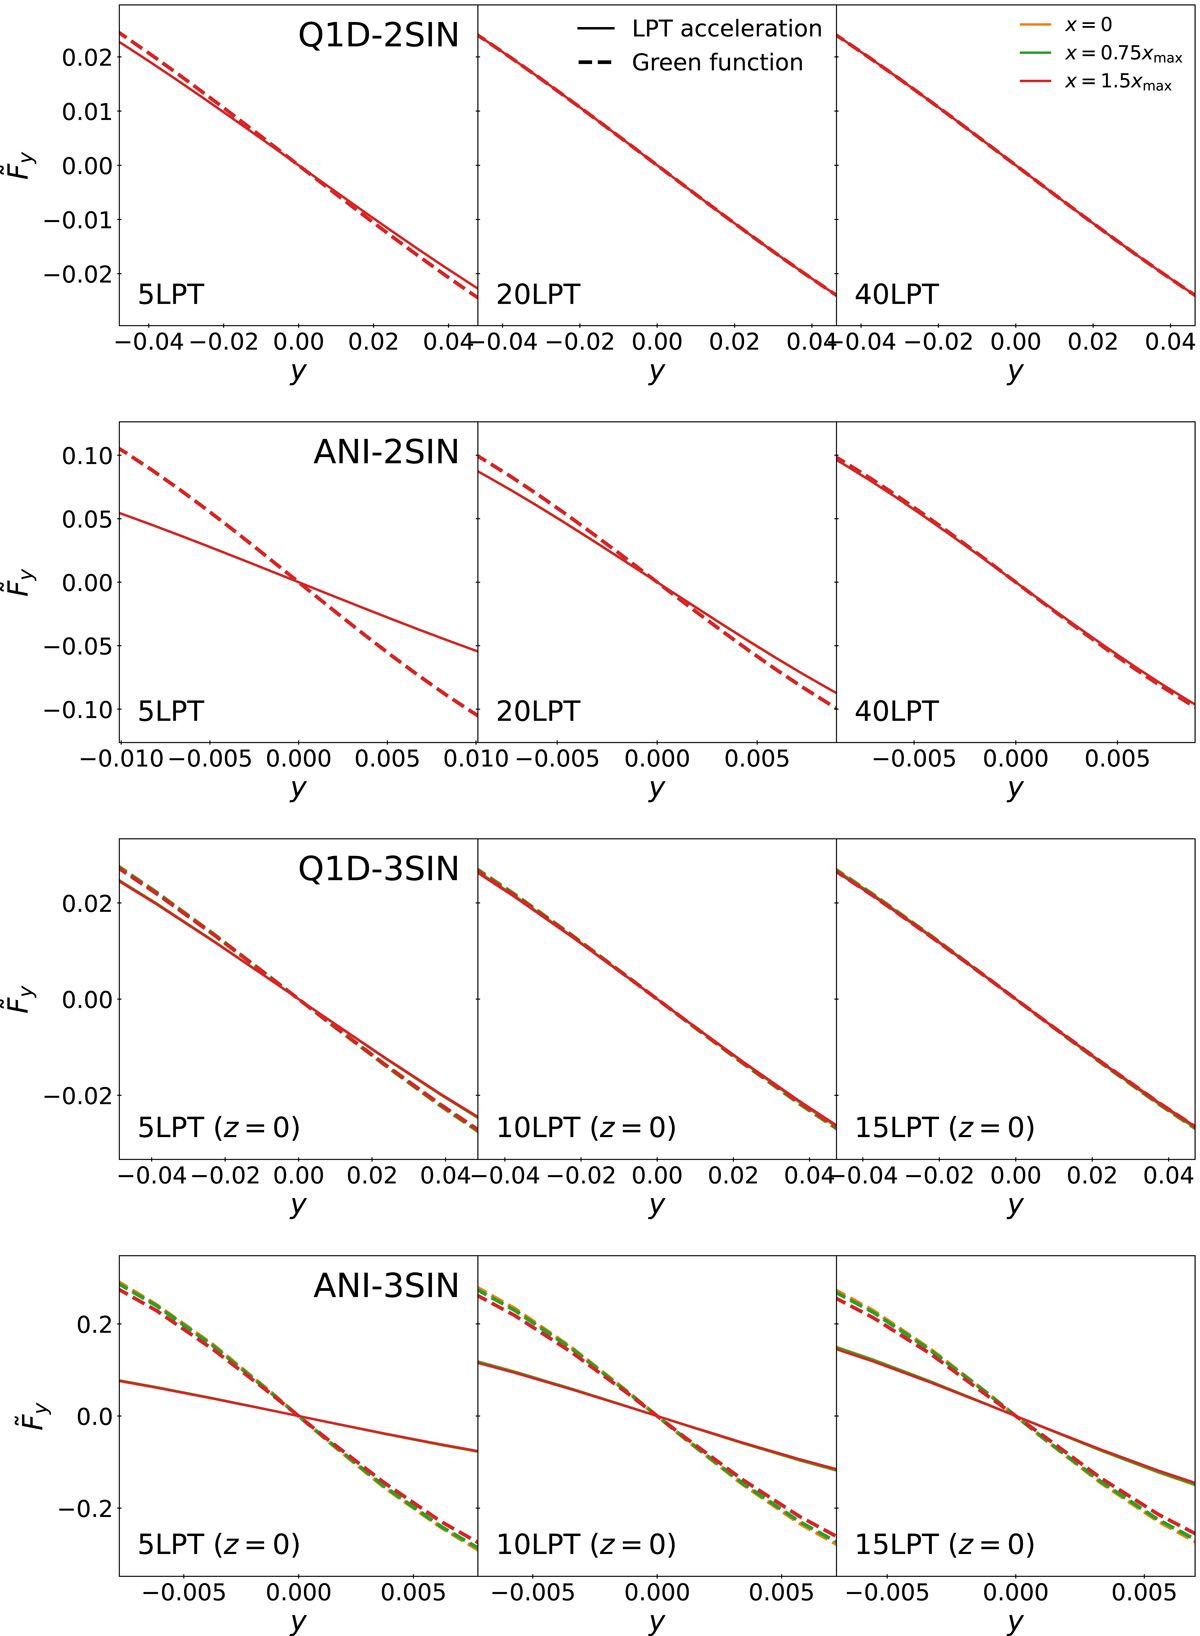
Same as Fig. 2 but for the y component of the force, Fy, in the range −1.8 ≤ y/ymax ≤ 1.8 for x/xmax = 0 (orange), 0.75 (green), and 1.5 (red). The dashed and solid lines represent, respectively, the force given in Eq. (14) and the LPT acceleration given in Eq. (15). Due to the weak dependence of Fy on the presence of the caustic and the very small range of values of x considered, the curves for x/xmax = 0, 0.75, and 1.5 nearly perfectly overlap.
Current usage metrics show cumulative count of Article Views (full-text article views including HTML views, PDF and ePub downloads, according to the available data) and Abstracts Views on Vision4Press platform.
Data correspond to usage on the plateform after 2015. The current usage metrics is available 48-96 hours after online publication and is updated daily on week days.
Initial download of the metrics may take a while.