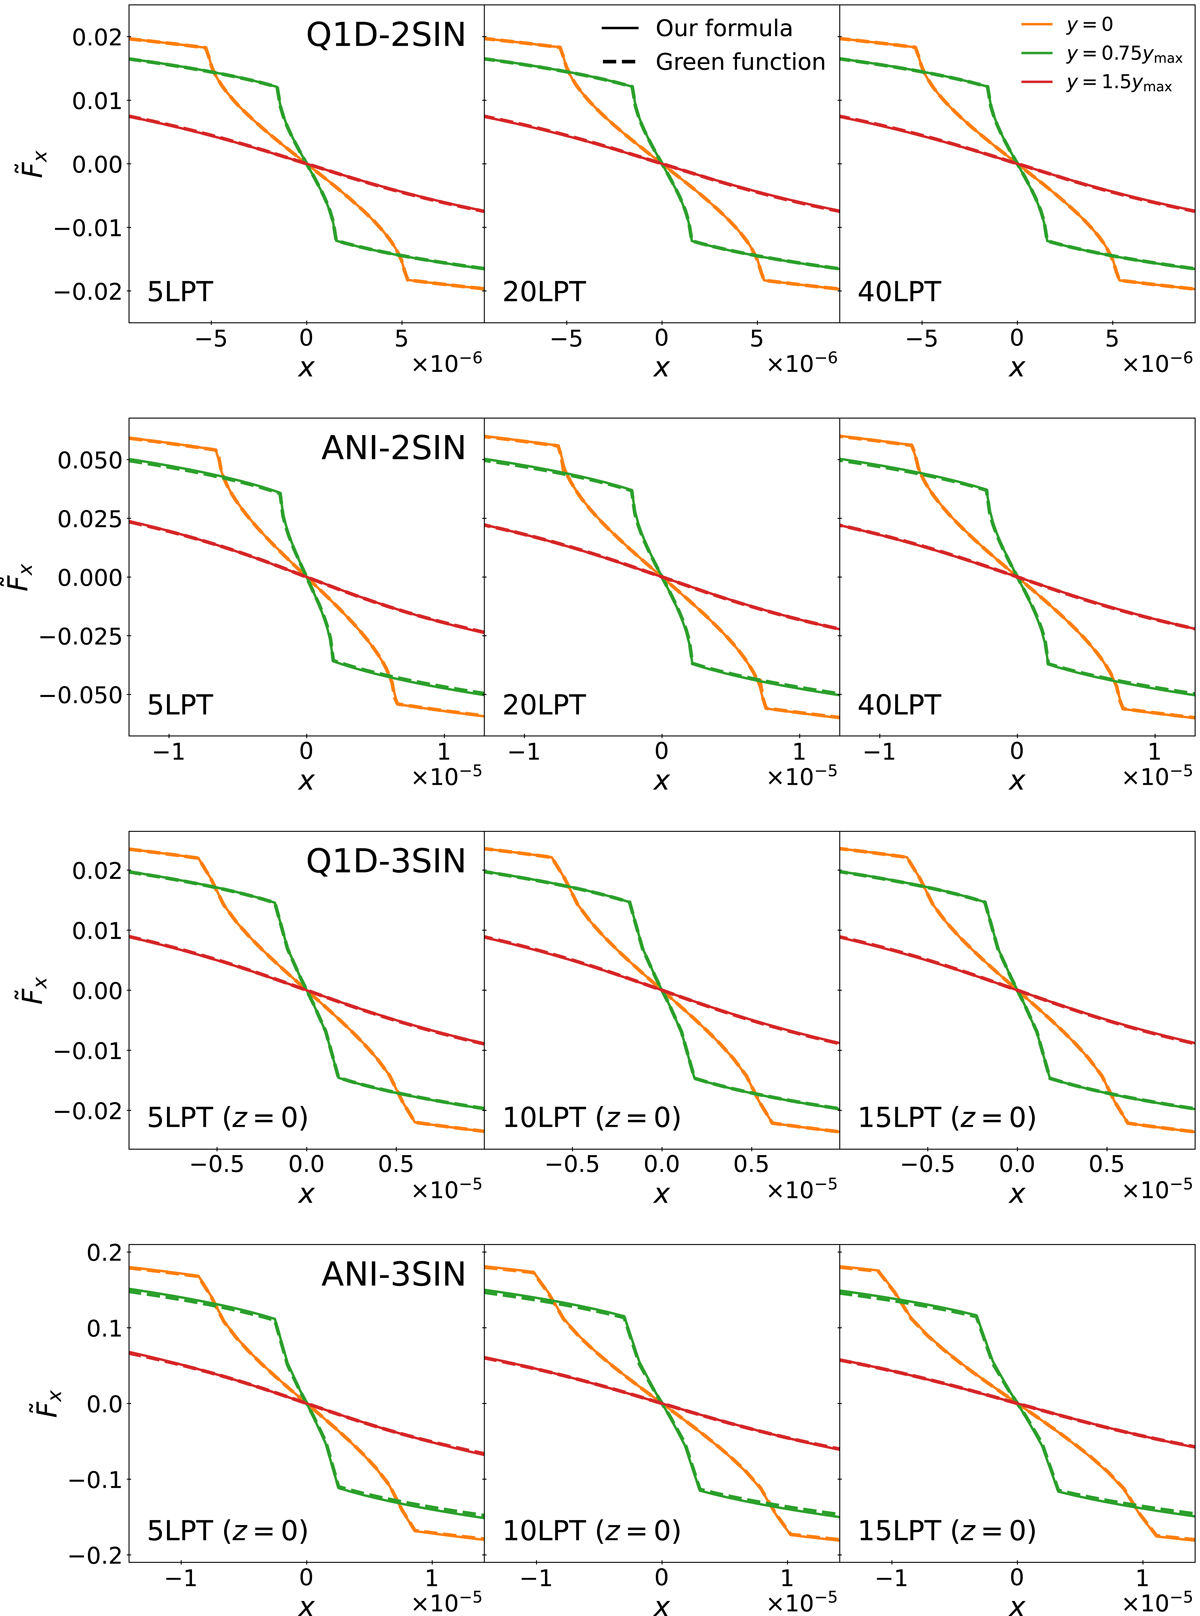
Fig. 2.
Download original image
x component of force as a function of x inside and in the vicinity of a pancake seeded by three sine waves in the context of LPT dynamics, with −1.8 ≤ x/xmax ≤ 1.8, where xmax is the maximum extension of the caustic region along the x-axis, as given by Eq. (44) in our approximate formalism. The output time is set to Δ = 0.001 with synchronisation (see Eq. (53)). In each panel, the curves of various colours correspond to different values of y (and z = 0 in the 3D case), namely y/ymax = 0 (orange), 0.75 (green), and 1.5 (red, outside the multi-stream region), where ymax is the maximum extension of the caustic region along the y-axis (Eq. (45)). From top to bottom, we consider Q1D-2SIN, ANI-2SIN, Q1D-3SIN, and ANI-3SIN. From left to right, the predictions are made with 5, 20 (10), and 40LPT (15LPT) for two-sine-wave (three-sine-wave) initial conditions. The dashed and solid lines respectively represent the ‘exact’ force given by Eq. (14) and the analytic prediction (51).
Current usage metrics show cumulative count of Article Views (full-text article views including HTML views, PDF and ePub downloads, according to the available data) and Abstracts Views on Vision4Press platform.
Data correspond to usage on the plateform after 2015. The current usage metrics is available 48-96 hours after online publication and is updated daily on week days.
Initial download of the metrics may take a while.