Fig. 5
Download original image
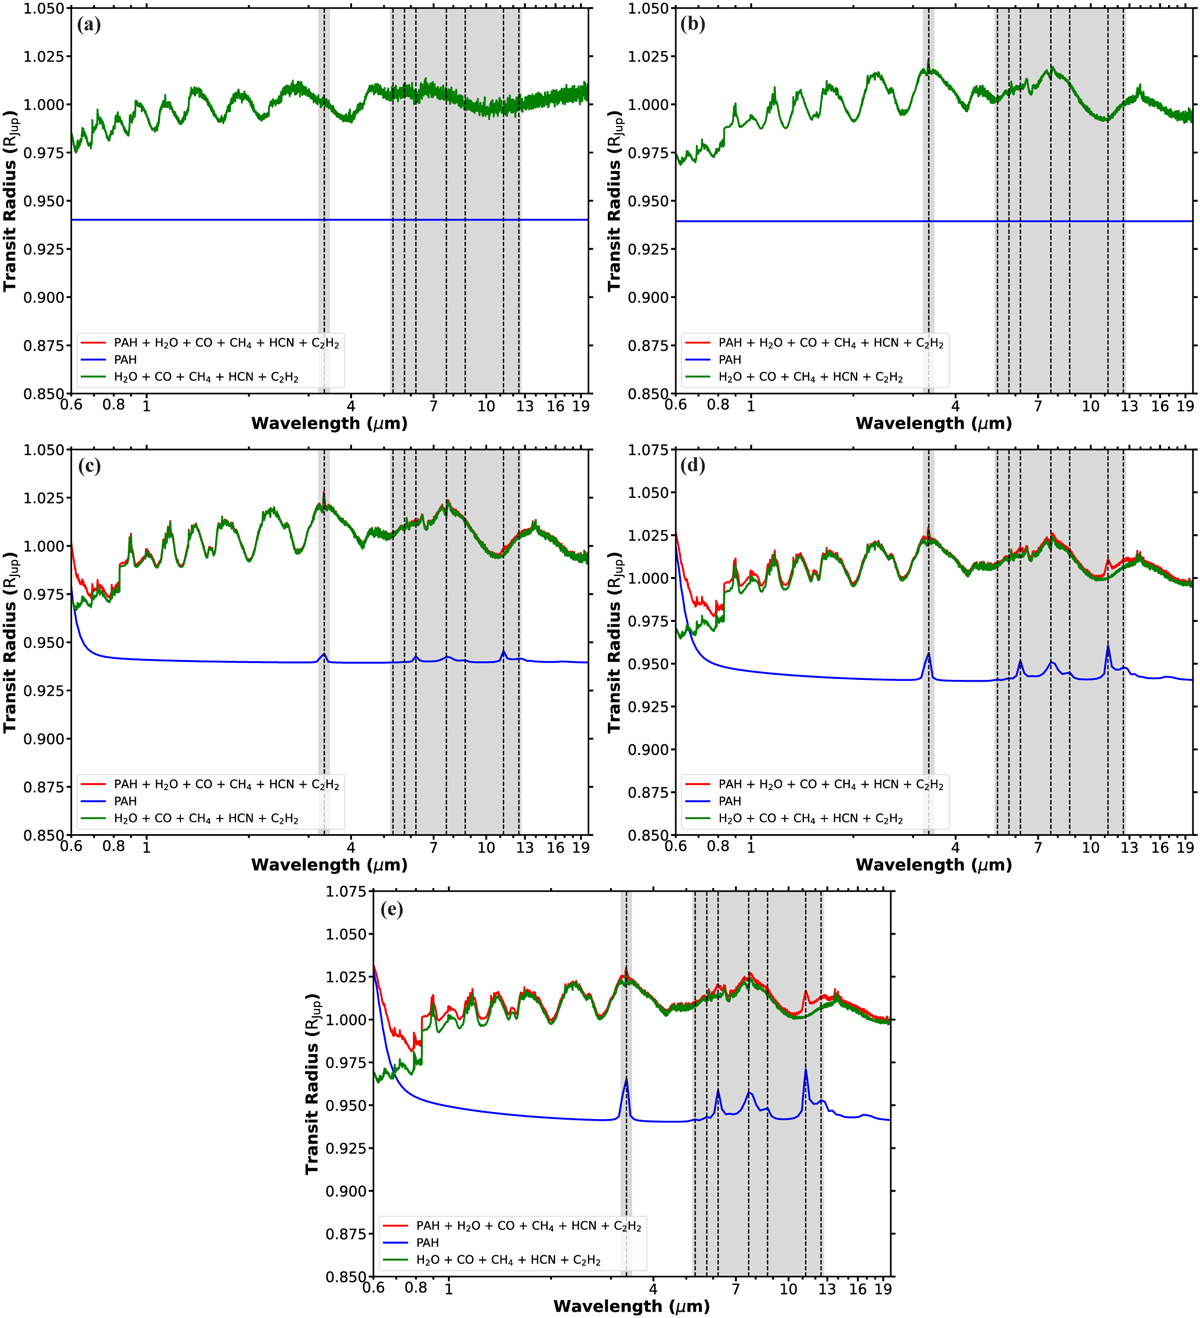
Transmission spectra for a modeled planet revolving around a G5 star (Teff = 1300 K, Tint = 200 K, [Fe/H] = 1.0, log(g) = 3.0) with different C/O ratios: (a) C/O = 0.55 (solar), (b) C/O = 0.80, (c) C/O = 1.00, (d) C/O = 1.25, and (e) C/O = 1.50. The blue line indicates the PAH cross section for the abundance obtained from the models for four PAHs together. The red and green lines represent transmission spectra with and without considering PAHs, respectively, in the atmosphere. The gray zones cover the areas with the most important PAH features (represented with the dotted lines) at 3.3 μm and 6–12 μm.
Current usage metrics show cumulative count of Article Views (full-text article views including HTML views, PDF and ePub downloads, according to the available data) and Abstracts Views on Vision4Press platform.
Data correspond to usage on the plateform after 2015. The current usage metrics is available 48-96 hours after online publication and is updated daily on week days.
Initial download of the metrics may take a while.