Fig. 3
Download original image
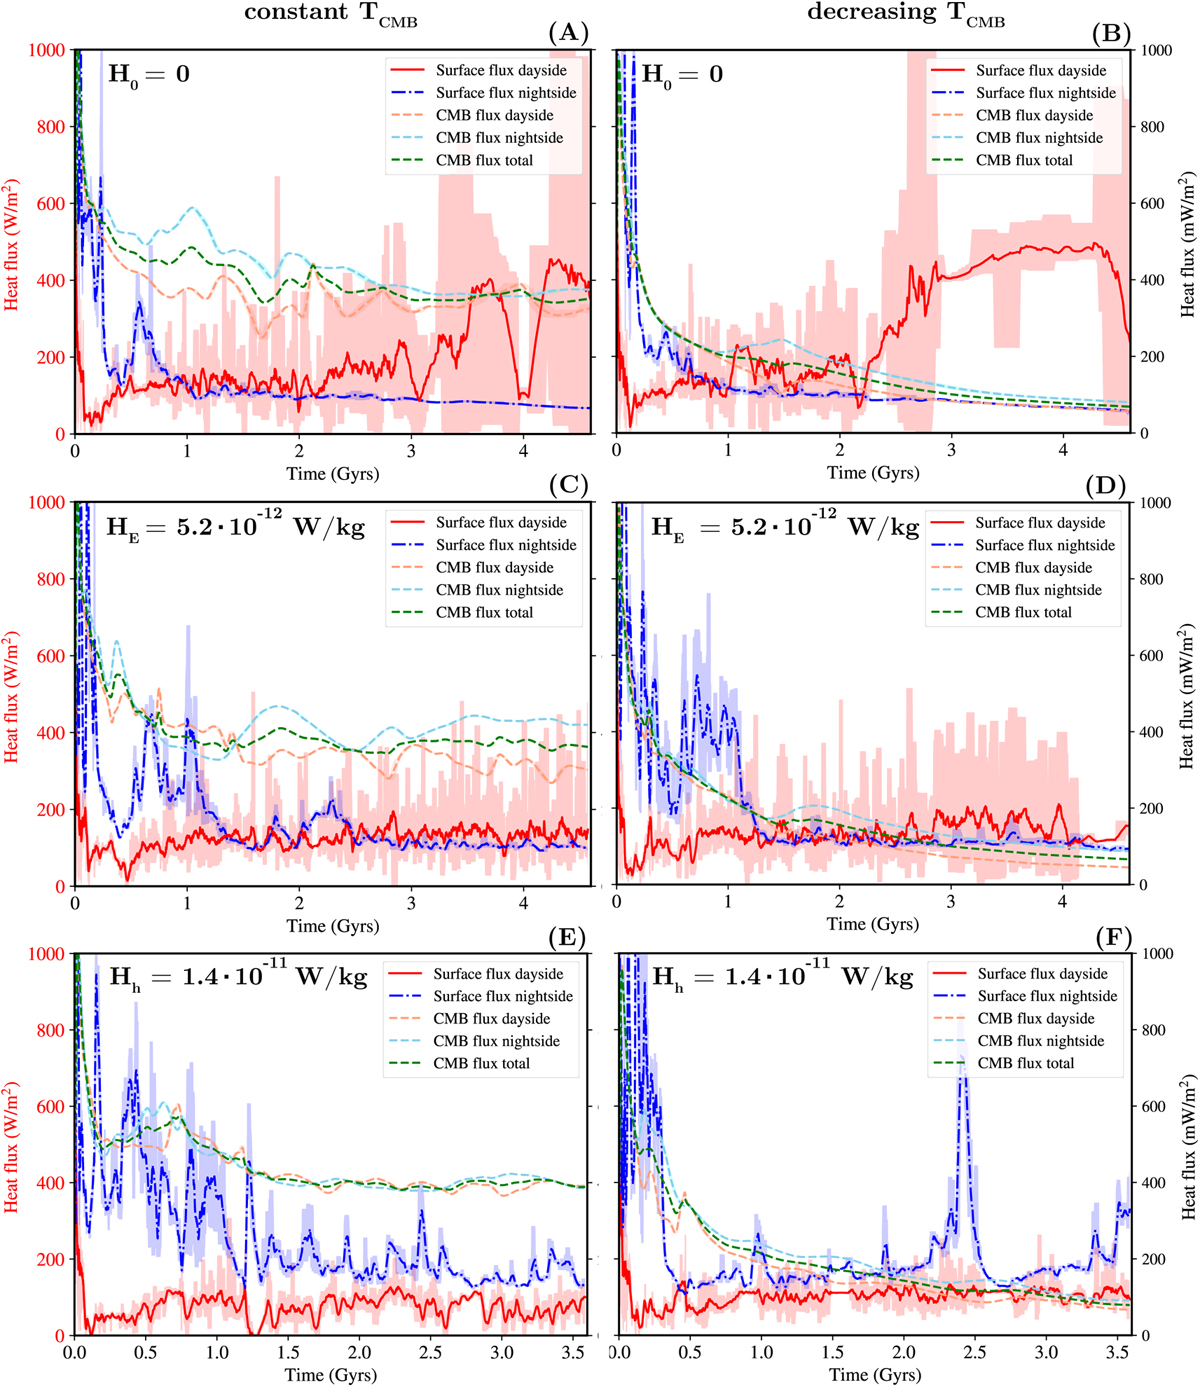
Surface and CMB heat flux for the 55 Cancri e models with Tday = 2800 K and Tnight = 1150 K. The nightside heat flux (blue dot-dashed line) and the CMB heat flux (dashed lines) have units of mW m−2 (right axis). The red solid line shows the dayside surface heat flux in W m−2 (left axis). The shaded regions on either side of the lines represent the minimum and maximum values within a moving average window. H0, HE, and Hh indicate no internal heating, Earth-like internal heating, and high internal heating, respectively. If the CMB temperature is constant, the heat flux from the CMB stabilises after roughly 1 Gyr. There is more variability in the surface heat flux for both the dayside and nightside heat flux. For all cases, the dayside and nightsides surface have thermal evolutions that are distinct from each other, and the dayside heat flux is around three orders of magnitude higher than the heat flux coming from the (partially molten) nightside.
Current usage metrics show cumulative count of Article Views (full-text article views including HTML views, PDF and ePub downloads, according to the available data) and Abstracts Views on Vision4Press platform.
Data correspond to usage on the plateform after 2015. The current usage metrics is available 48-96 hours after online publication and is updated daily on week days.
Initial download of the metrics may take a while.