Fig. A.1
Download original image
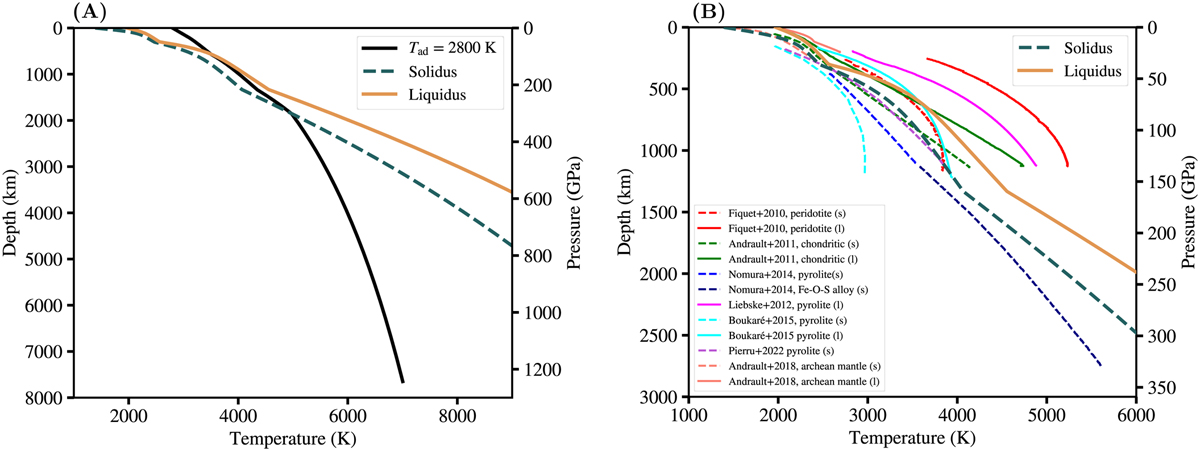
Solidus and liquidus curves. (A) Solidus and liquidus curves used in this study. The black line shows an adiabat with surface temperature Tsurf = 2800 K where latent heat effects are included in the mixed phase region (0 < ϕ < 1). (B) Zoomed-in view of the region extending to a depth of 3000 km with comparison to different solidus and liquidus curves at higher pressures from experimental and thermodynamic calculation studies. (s) indicates the solidus curves (dashed lines) and (l) indicates the liquidus curves (solid lines).
Current usage metrics show cumulative count of Article Views (full-text article views including HTML views, PDF and ePub downloads, according to the available data) and Abstracts Views on Vision4Press platform.
Data correspond to usage on the plateform after 2015. The current usage metrics is available 48-96 hours after online publication and is updated daily on week days.
Initial download of the metrics may take a while.