Fig. 10
Download original image
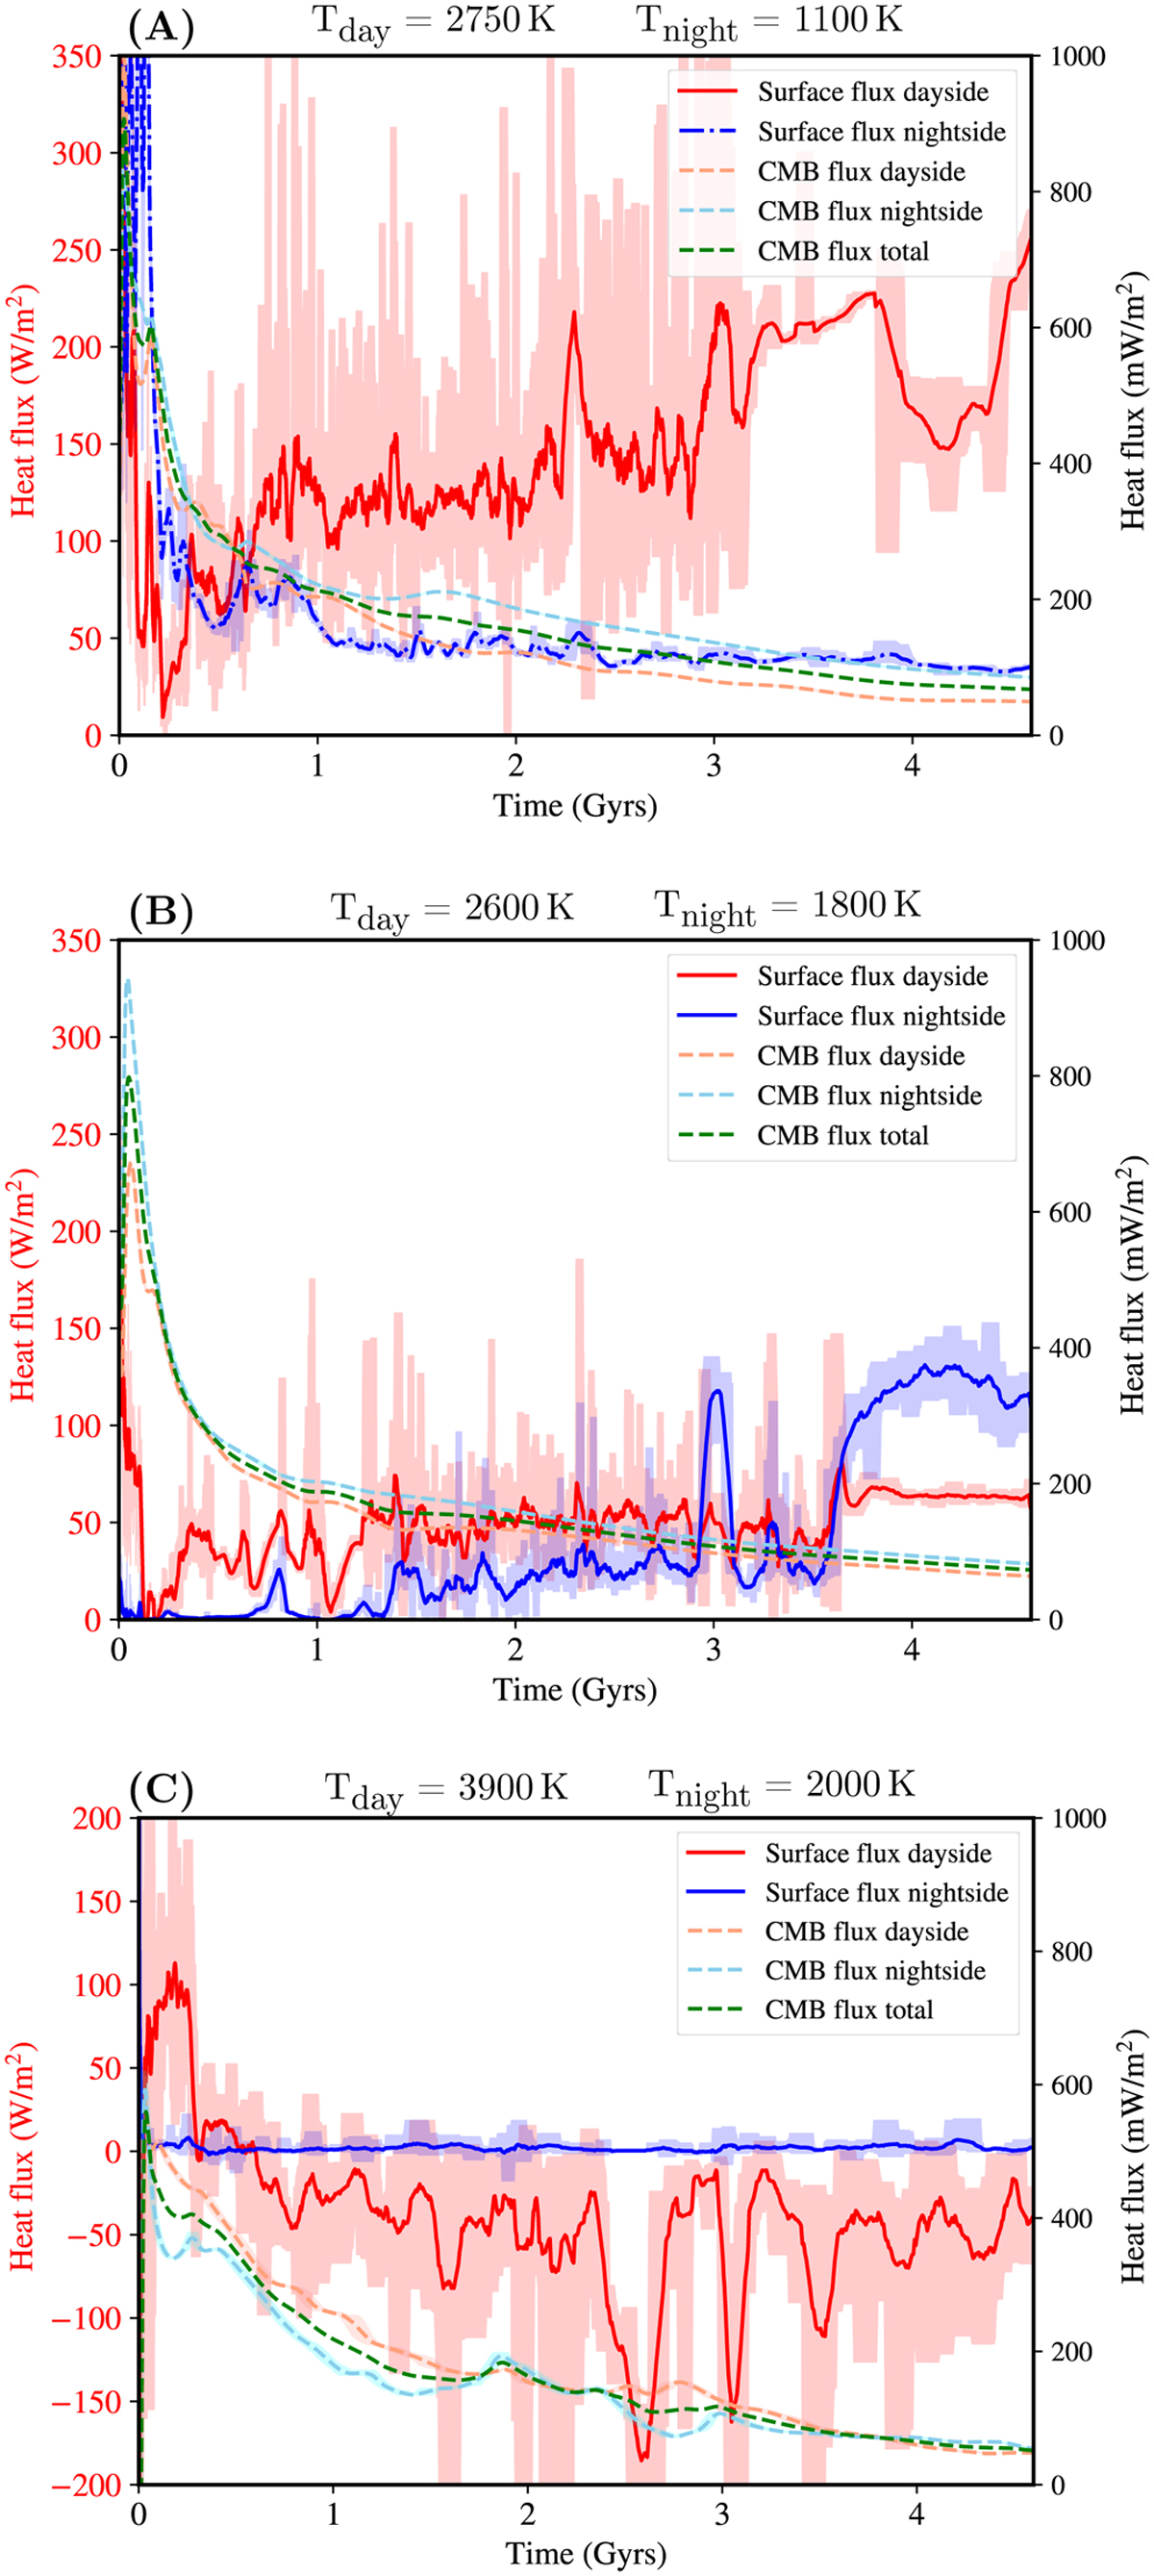
Surface and CMB heat flux for models with different surface temperature contrasts. The dashed lines are in mW m−2 (right axis) and the solid lines in W m−2 (left axis). The shaded regions on either side of the lines represent the minimum and maximum values within a moving average window. If the nightside is not fully molten, the day-side heat flux is roughly three orders of magnitude higher than the nightside heatflux (A). For the case with Tday = 2600 K and Tnight = 1800 K, the surface fluxes are of the same order of magnitude (B). For Tday = 3900 K and Tnight = 2000 K, the nightside heat flux varies in the range 1–4 W m−2, whereas the dayside heat flux varies from 0 to −200 W m−2 (C).
Current usage metrics show cumulative count of Article Views (full-text article views including HTML views, PDF and ePub downloads, according to the available data) and Abstracts Views on Vision4Press platform.
Data correspond to usage on the plateform after 2015. The current usage metrics is available 48-96 hours after online publication and is updated daily on week days.
Initial download of the metrics may take a while.