Fig. 8.
Download original image
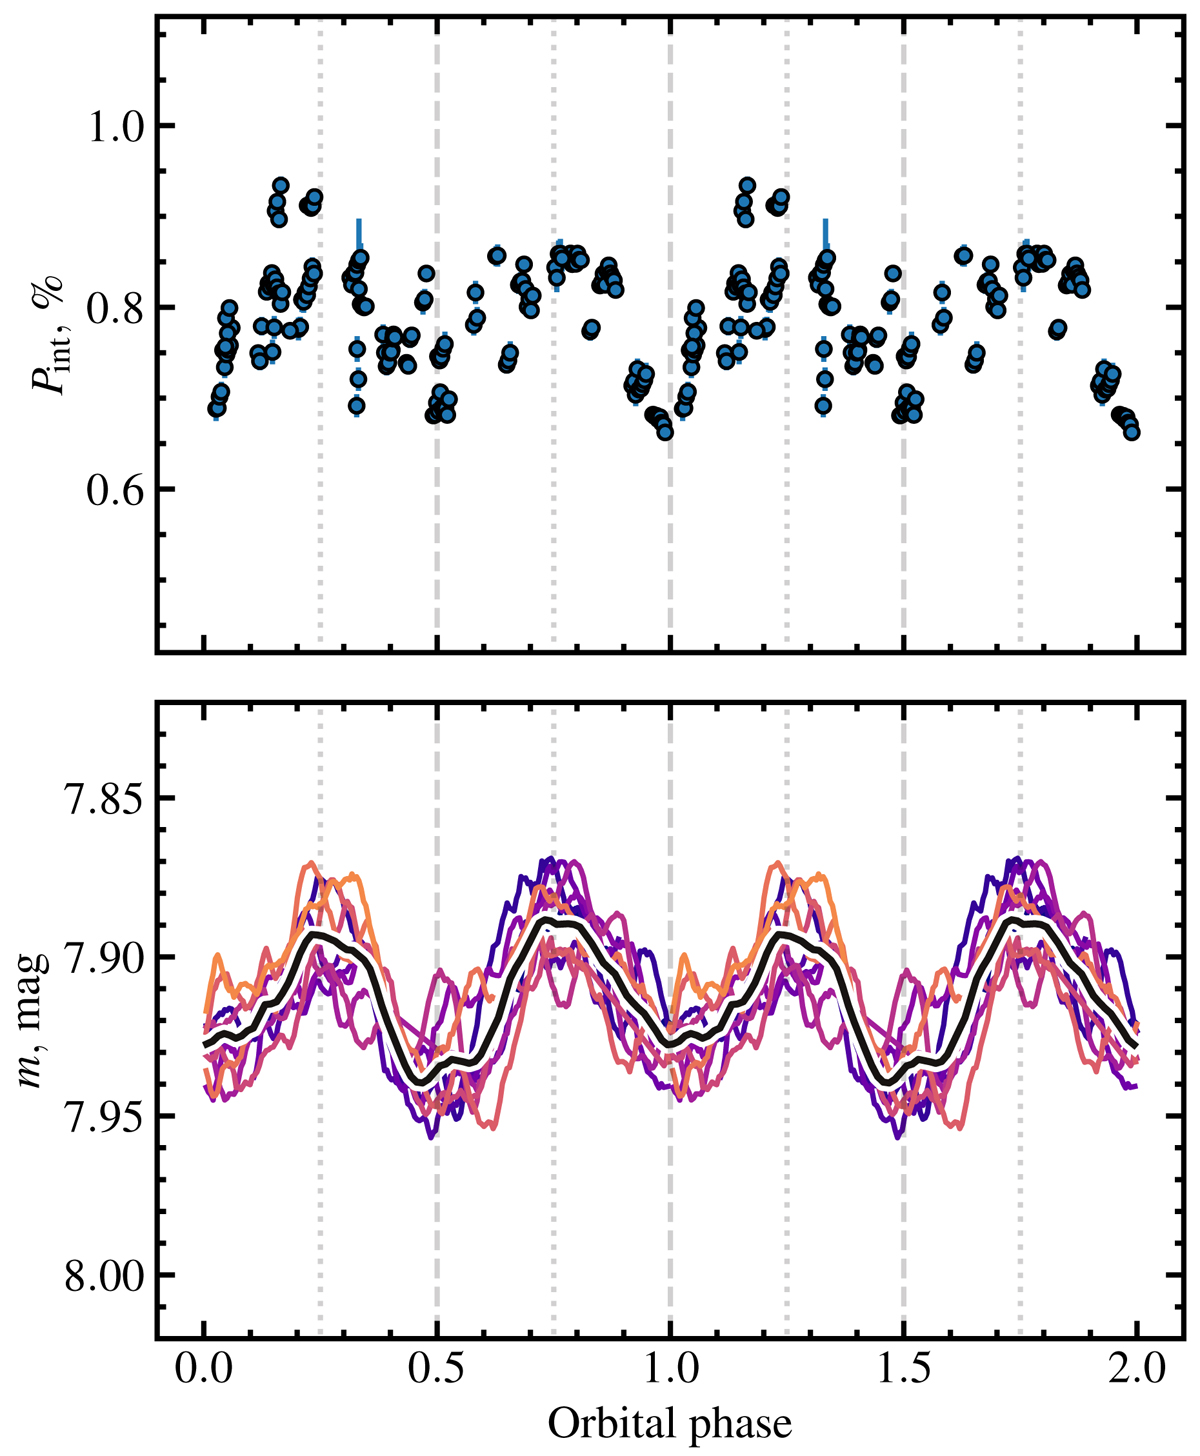
Orbital profiles of the polarization and flux of Cyg X-1 in the optical band. Top panel: intrinsic polarization of Cyg X-1 in the R filter, folded with the orbital period (seasons 1–3 are plotted). Each circle with the 1σ error bar shows the average polarization, calculated within a 30-min bin. Bottom panel: TESS magnitude of Cyg X-1, folded with the orbital period. Different colors (from cold to warm) correspond to different orbital periods T1–T11. The solid black line shows the average orbital profile.
Current usage metrics show cumulative count of Article Views (full-text article views including HTML views, PDF and ePub downloads, according to the available data) and Abstracts Views on Vision4Press platform.
Data correspond to usage on the plateform after 2015. The current usage metrics is available 48-96 hours after online publication and is updated daily on week days.
Initial download of the metrics may take a while.