Open Access
Fig. 2.
Download original image
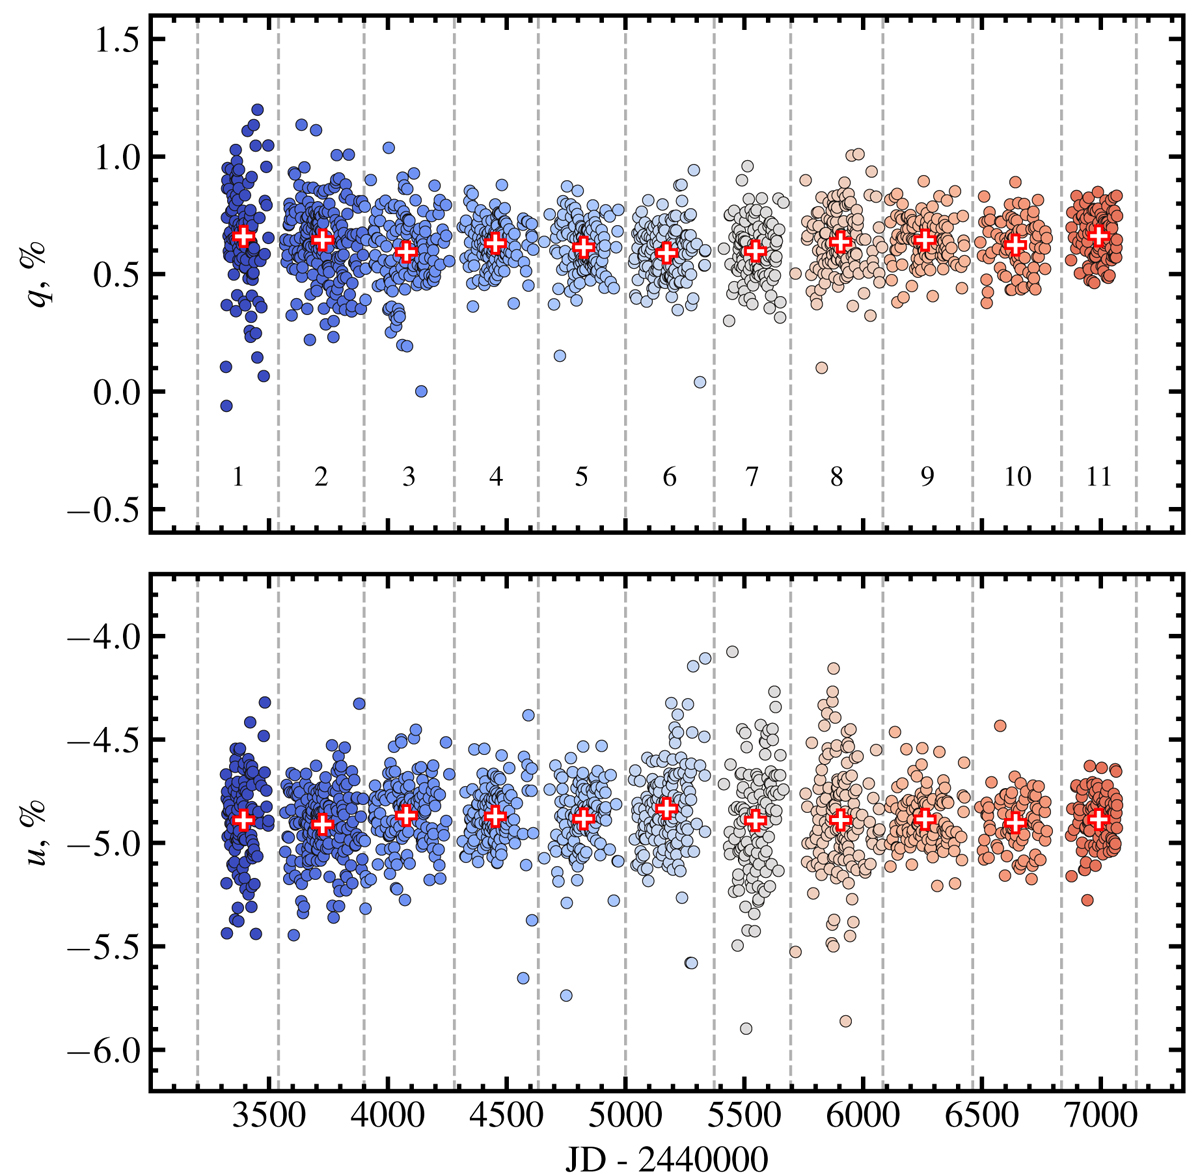
Long-term variations in the normalized Stokes parameters q and u of Cyg X-1, measured in 1975–1987. The vertical dashed lines separate 11 observing seasons, which is roughly equal to one year of observations. The red crosses show season-averaged values.
Current usage metrics show cumulative count of Article Views (full-text article views including HTML views, PDF and ePub downloads, according to the available data) and Abstracts Views on Vision4Press platform.
Data correspond to usage on the plateform after 2015. The current usage metrics is available 48-96 hours after online publication and is updated daily on week days.
Initial download of the metrics may take a while.