Fig. 14.
Download original image
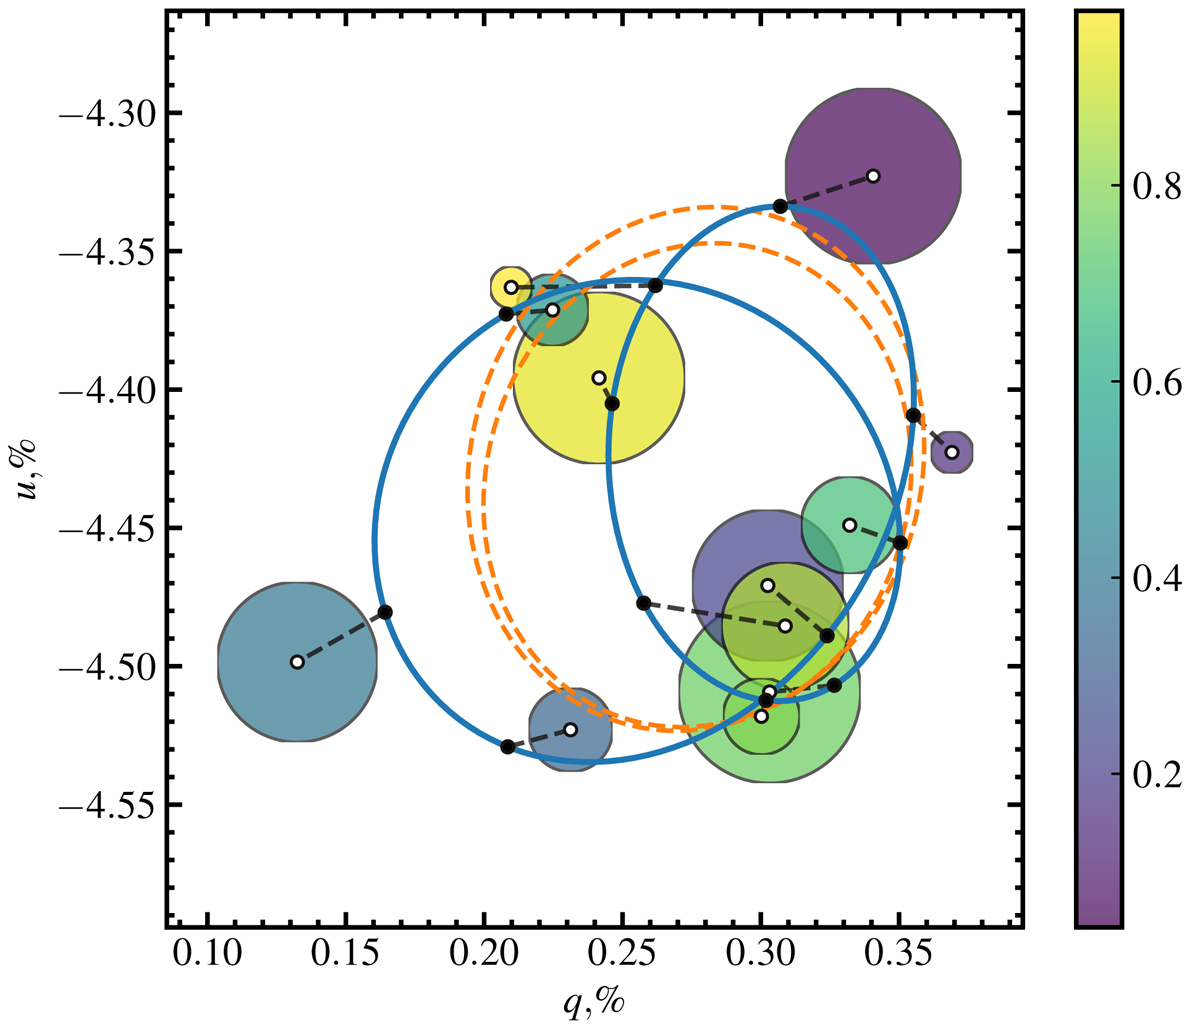
Average Stokes parameters of Cyg X-1 obtained during season 2 in the R band. The color coding and size of the circle correspond to the orbital phase and 1σ uncertainty, respectively. The solid blue curve corresponds to the best fit with the Fourier series given by Eq. (2). The dashed orange line corresponds to the to the best-fit model of a scattering cloud on an eccentric orbit from the appendix of Kravtsov et al. (2020).
Current usage metrics show cumulative count of Article Views (full-text article views including HTML views, PDF and ePub downloads, according to the available data) and Abstracts Views on Vision4Press platform.
Data correspond to usage on the plateform after 2015. The current usage metrics is available 48-96 hours after online publication and is updated daily on week days.
Initial download of the metrics may take a while.