Open Access
Fig. 13.
Download original image
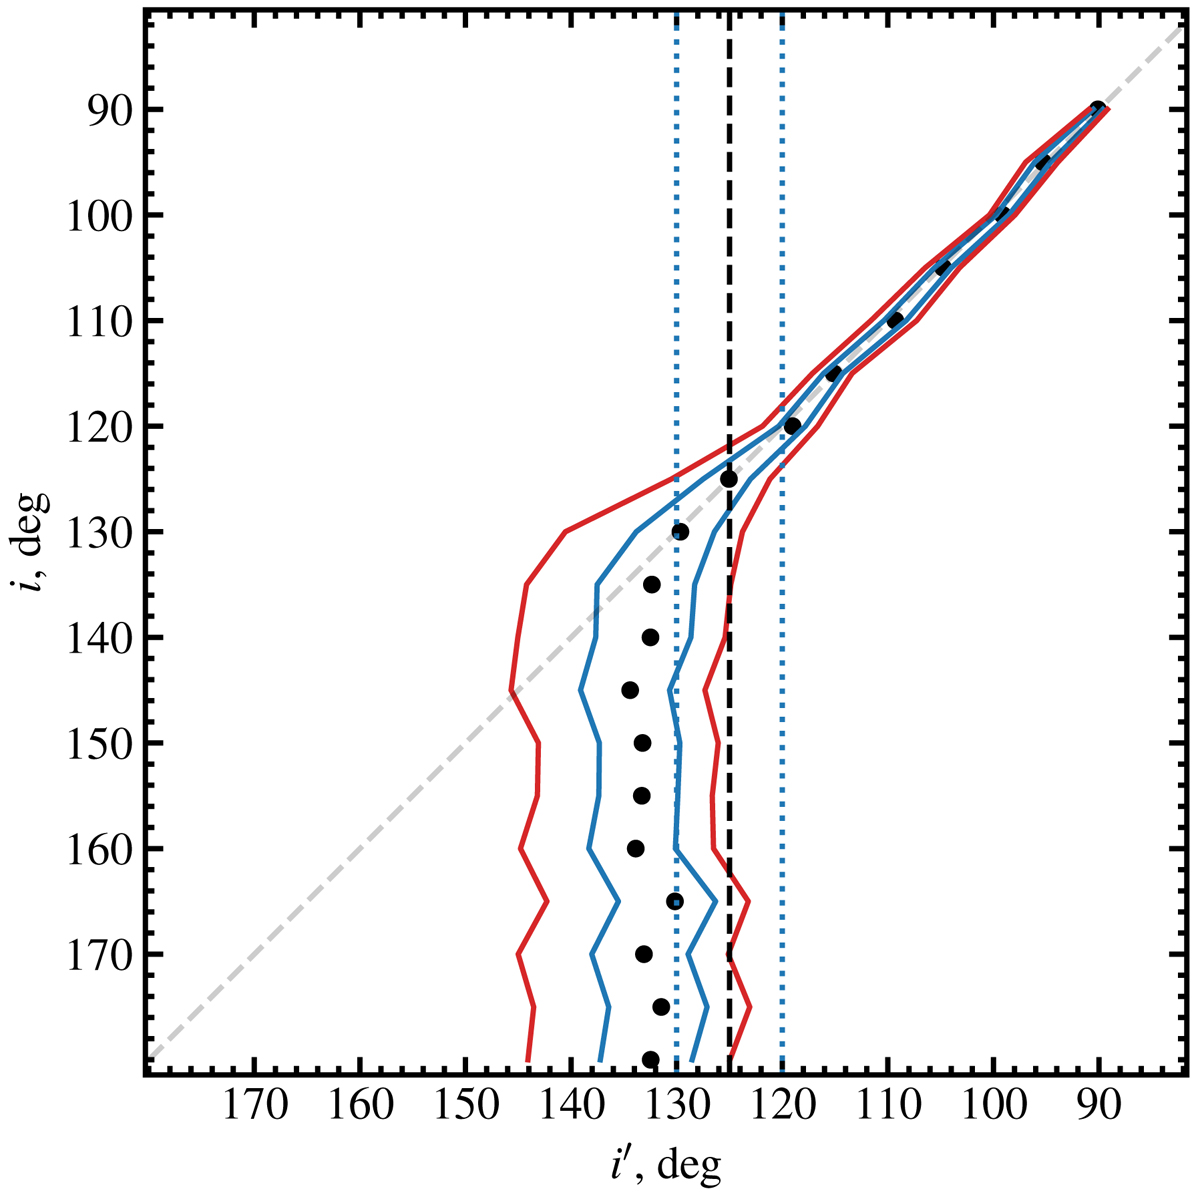
Estimated 1σ and 2σ confidence intervals on the true inclination i for given estimate i′ (solid blue and red lines). The vertical dashed black line corresponds to the best-fit inclination of Cyg X-1. The vertical dotted blue lines correspond to the 1σ error on the best-fit inclination.
Current usage metrics show cumulative count of Article Views (full-text article views including HTML views, PDF and ePub downloads, according to the available data) and Abstracts Views on Vision4Press platform.
Data correspond to usage on the plateform after 2015. The current usage metrics is available 48-96 hours after online publication and is updated daily on week days.
Initial download of the metrics may take a while.