Fig. 12.
Download original image
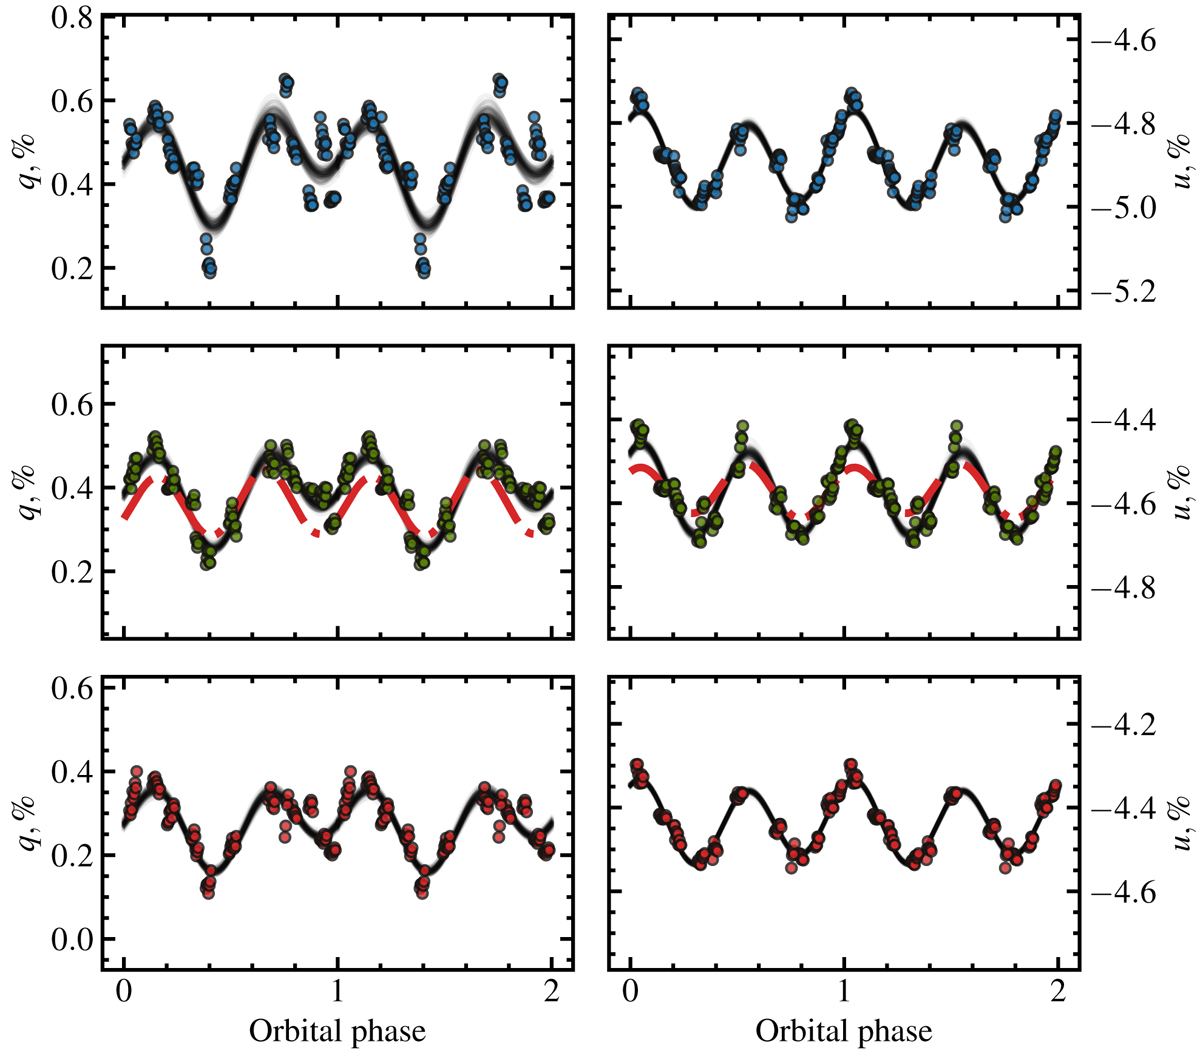
Variability in the observed Stokes parameters of Cyg X-1, obtained during season 2 in B, V, and R bands (top, middle, and bottom panels, respectively). Each circle corresponds to the average value, calculated within a 30-min bin. The 1σ errors are smaller than the symbol size. The solid black lines correspond to the best fit with the Fourier series given by Eq. (2). The dashed red lines in the middle panels show the best fit of PMO historical V -band data with the same model, shifted vertically to overlap our data.
Current usage metrics show cumulative count of Article Views (full-text article views including HTML views, PDF and ePub downloads, according to the available data) and Abstracts Views on Vision4Press platform.
Data correspond to usage on the plateform after 2015. The current usage metrics is available 48-96 hours after online publication and is updated daily on week days.
Initial download of the metrics may take a while.