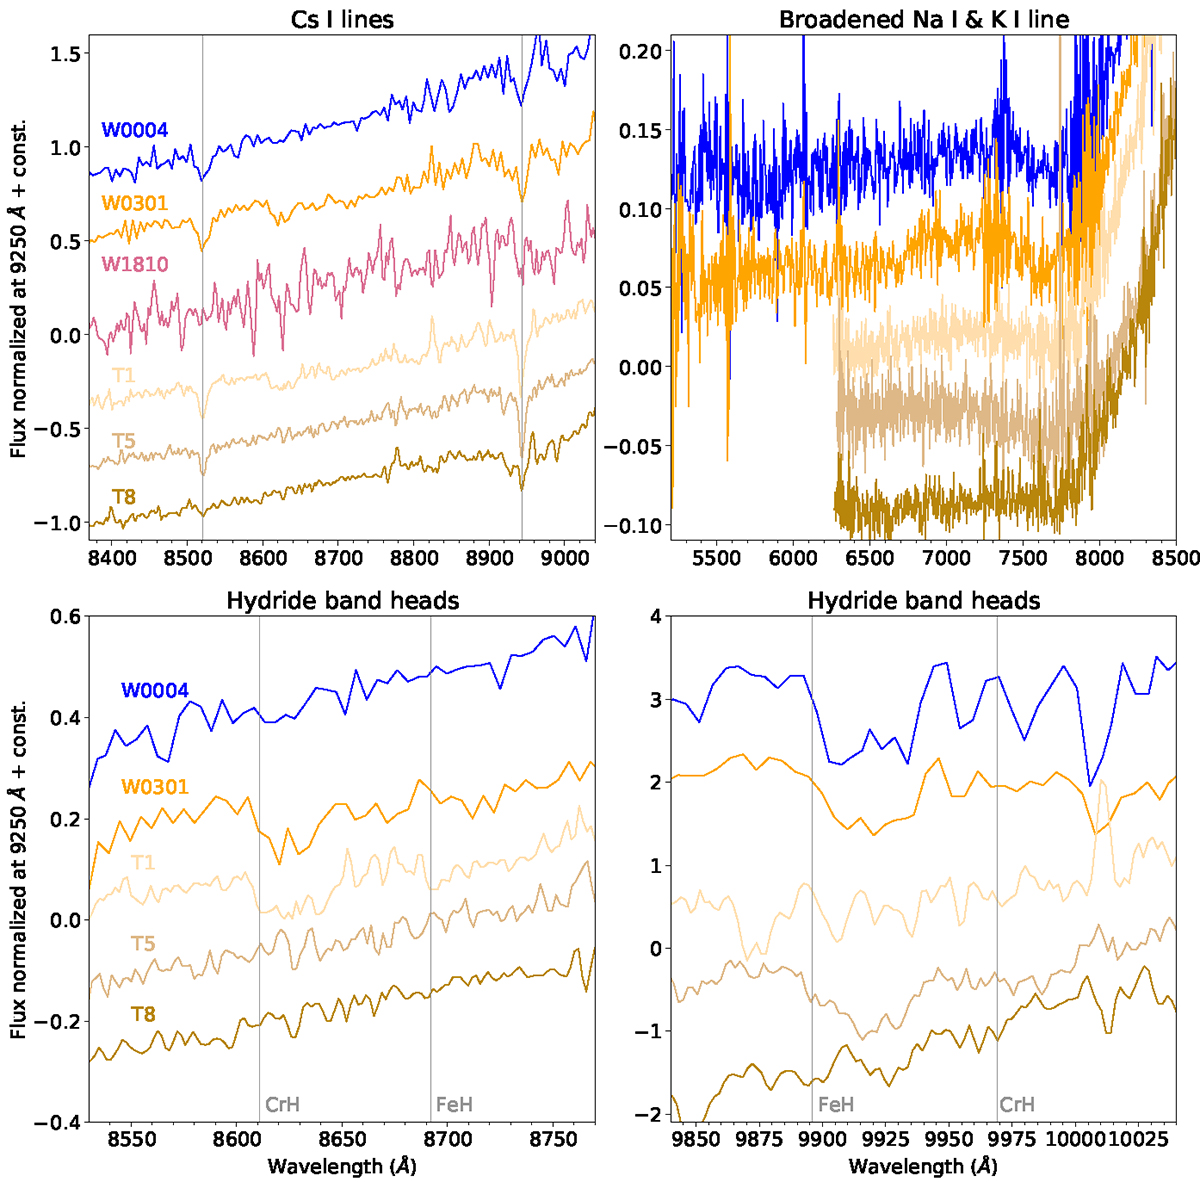
Fig. 3.
Download original image
Optical spectra normalized at 9250 Å on a linear scale in the alkali metal line region (Cs, Na and K, two top panels), and the hydride band regions (FeH and CrH, two bottom panels) of the two T subdwarf candidates and WISE1810 compared with three T dwarf templates. We did not plot the spectrum of WISE1810 because of its low signal-to-noise ratio.
Current usage metrics show cumulative count of Article Views (full-text article views including HTML views, PDF and ePub downloads, according to the available data) and Abstracts Views on Vision4Press platform.
Data correspond to usage on the plateform after 2015. The current usage metrics is available 48-96 hours after online publication and is updated daily on week days.
Initial download of the metrics may take a while.