Fig. 2.
Download original image
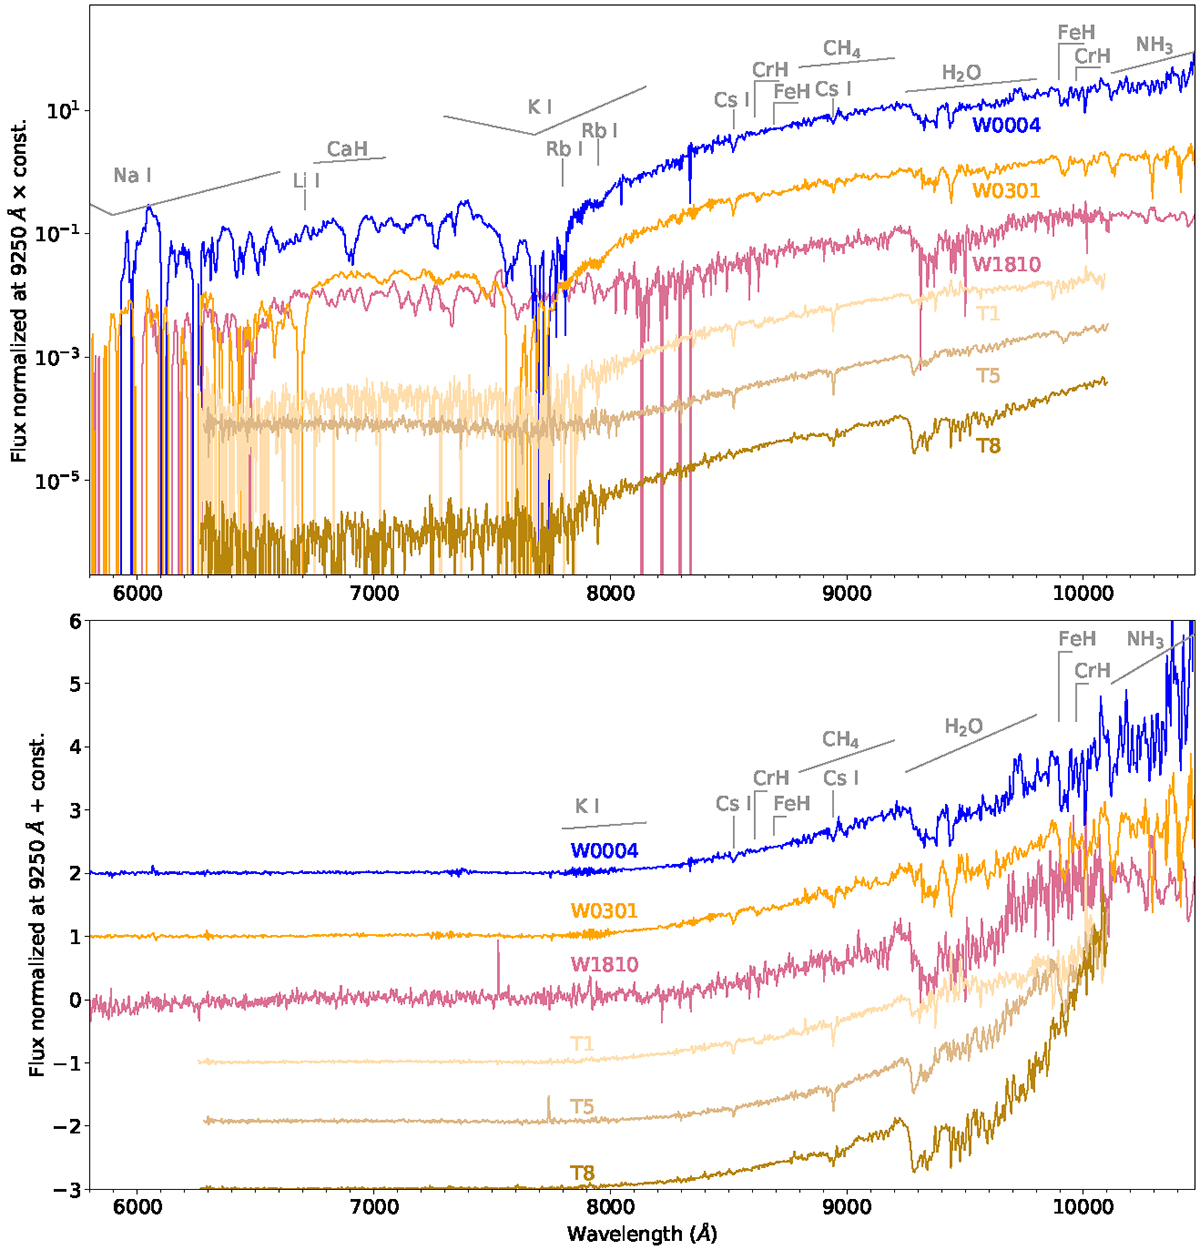
Full optical spectra from 5800 Å to 10470 Å normalized at 9250 Å in a logarithmic and a linear scale of the two T subdwarf candidates and WISE1810, with the alkali atomic lines (vertical lines or pressure broadened V-shaped lines), molecular bands (horizontal lines), and band heads (vertical lines with a dash). In the logarithmic scale plot, we smoothed the parts below 8000 Å of these three spectra to not let the noise block our sight. We plotted optical spectra of the T1 standard SDSS0837, the T5 standard 2MASS0755, and the T8 standard 2MASS0415 (Burgasser et al. 2003a) for comparison.
Current usage metrics show cumulative count of Article Views (full-text article views including HTML views, PDF and ePub downloads, according to the available data) and Abstracts Views on Vision4Press platform.
Data correspond to usage on the plateform after 2015. The current usage metrics is available 48-96 hours after online publication and is updated daily on week days.
Initial download of the metrics may take a while.