Fig. 1.
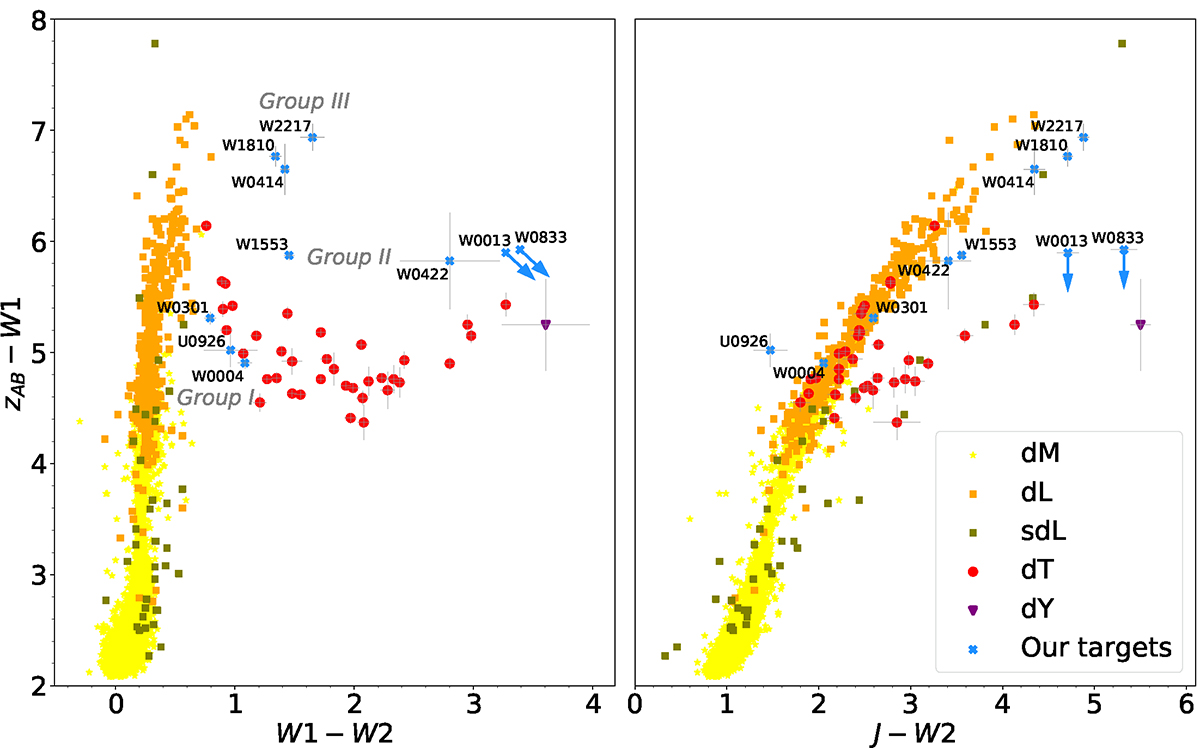
Download original image
W1 − W2 vs zAB − W1 and J − W2 vs zAB − W1 colour–colour diagrams of all the T subdwarf candidates in Table 5, except ULAS1319, which has neither W1 nor W2 magnitudes, and ULAS1316 whose photometry was contaminated by a background galaxy. For WISE0833 and WISE0013, we used arrows to indicate the lower limit of the W1 magnitude. We also included normal M, L, and T sequences; sub-L dwarfs; and a Y dwarf. All the T dwarfs, the Y dwarf, and our objects have error bars. In the first diagram, the candidates clearly separate into three groups.
Current usage metrics show cumulative count of Article Views (full-text article views including HTML views, PDF and ePub downloads, according to the available data) and Abstracts Views on Vision4Press platform.
Data correspond to usage on the plateform after 2015. The current usage metrics is available 48-96 hours after online publication and is updated daily on week days.
Initial download of the metrics may take a while.