Fig. 9
Download original image
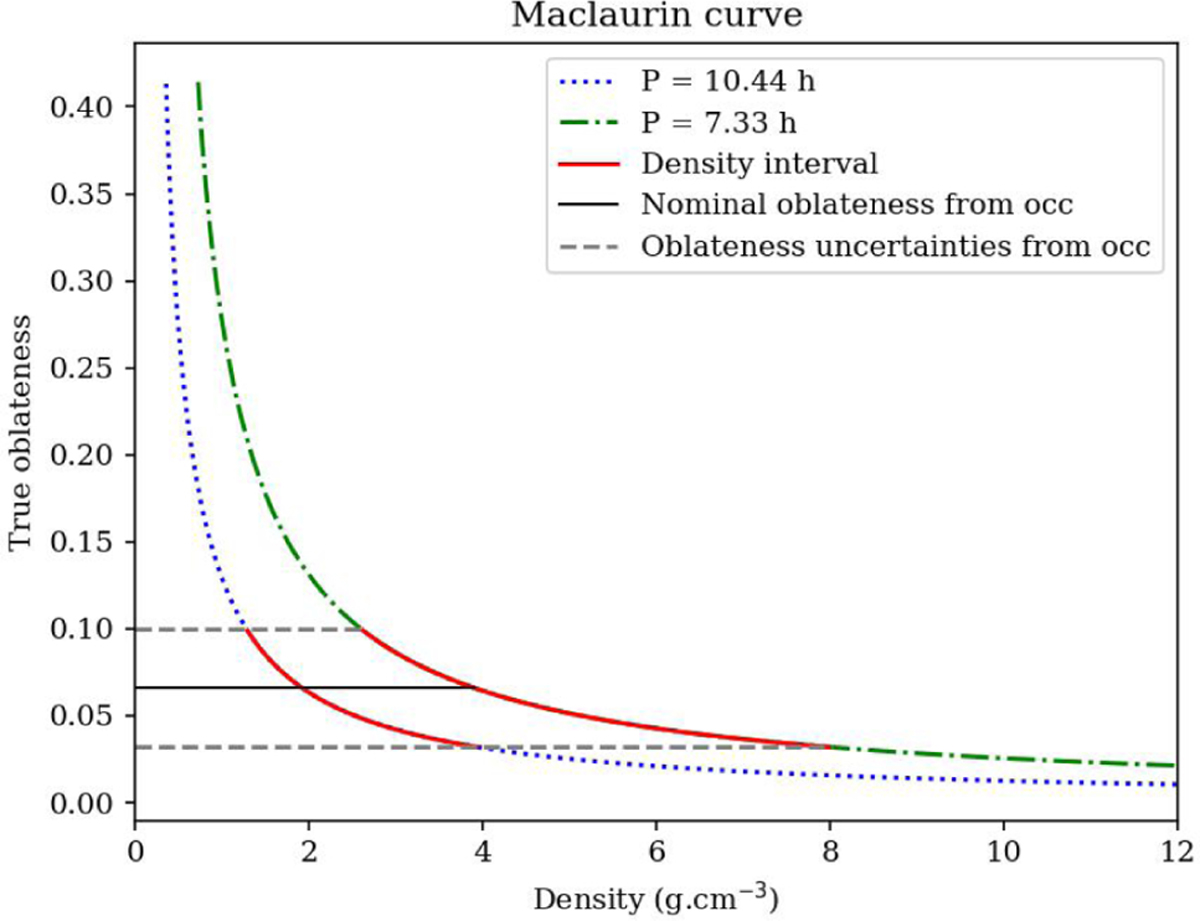
Relation between the true oblateness and the density of a Maclaurin spheroid for the rotational periods of 10.44 h (blue dotted line) and 7.33 h (green dashed line). The solid black line is the nominal oblateness value with uncertainties (gray dashed lines) derived from the multichord stellar occultation event. Red segments present the global density interval for each rotational period assuming that the apparent oblateness corresponds to the real one.
Current usage metrics show cumulative count of Article Views (full-text article views including HTML views, PDF and ePub downloads, according to the available data) and Abstracts Views on Vision4Press platform.
Data correspond to usage on the plateform after 2015. The current usage metrics is available 48-96 hours after online publication and is updated daily on week days.
Initial download of the metrics may take a while.