Fig. 7
Download original image
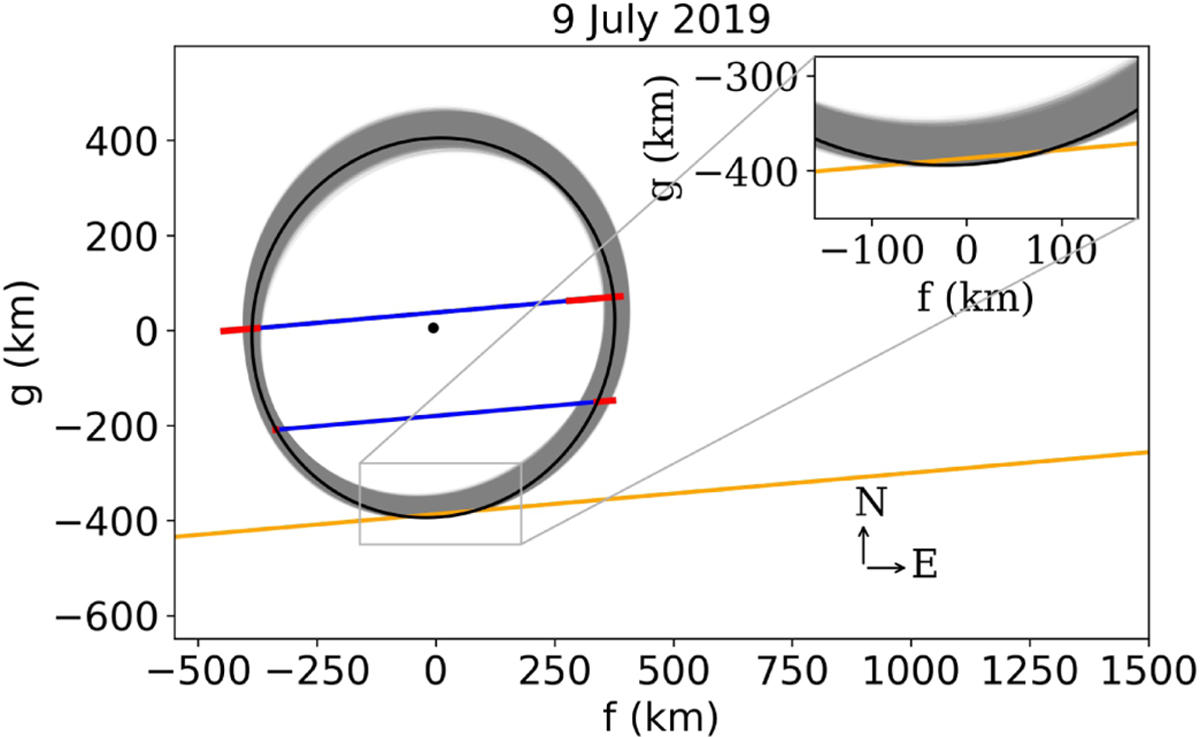
Positive data from the stellar occultation on 9 July 2019 shown as the blue segments. The 1σ uncertainties are in red, and the negative chord acquired from the Ponta Grossa station is in orange. The best-fitted ellipse is in black, with the center presented by the black dot, and the solutions in the 3σ range are in gray. The fit considers topographic features up to 7 km in size. Thus, the ellipses crossing the negative chord are in this range.
Current usage metrics show cumulative count of Article Views (full-text article views including HTML views, PDF and ePub downloads, according to the available data) and Abstracts Views on Vision4Press platform.
Data correspond to usage on the plateform after 2015. The current usage metrics is available 48-96 hours after online publication and is updated daily on week days.
Initial download of the metrics may take a while.