Fig. 6
Download original image
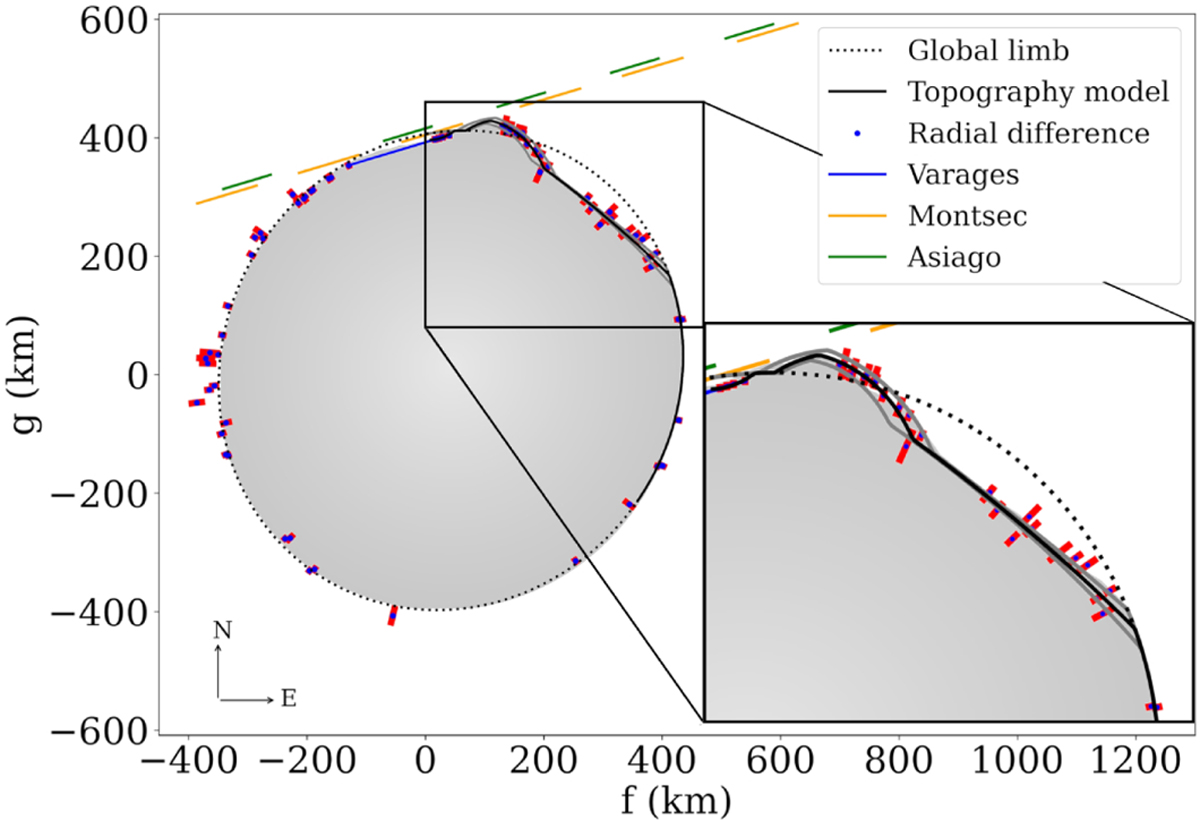
RD points projected at the sky plane in blue points, with 1σ uncertainties in red. The blue segment is the positive detection from Varages station. Orange and green segments correspond to negative frames acquired in Montsec and Asiago stations, respectively. In black, the dotted line is the best-fitted global limb model described in Sect. 3.1, and the solid line is the model for local topography. The solid gray lines limit the topographic model’s 1σ-error bars. Finally, the filled gray color shows the proposed global limb with topography.
Current usage metrics show cumulative count of Article Views (full-text article views including HTML views, PDF and ePub downloads, according to the available data) and Abstracts Views on Vision4Press platform.
Data correspond to usage on the plateform after 2015. The current usage metrics is available 48-96 hours after online publication and is updated daily on week days.
Initial download of the metrics may take a while.