Fig. 5
Download original image
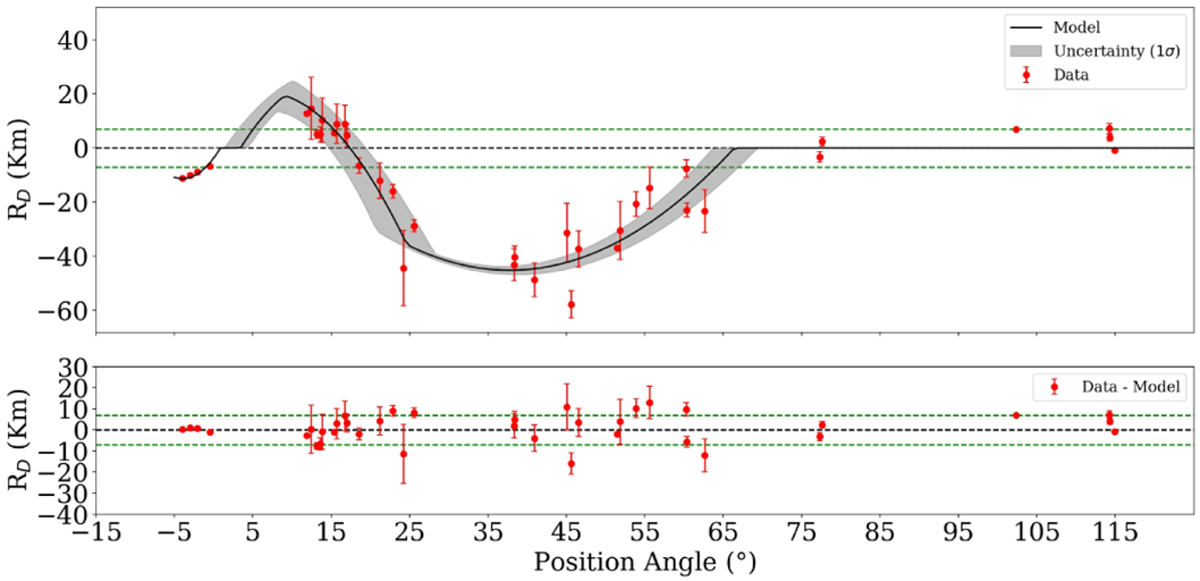
Limits of the assumed ±7 km tolerance (see text) shown as horizontal green lines and the black dashed line is the best-fit ellipse. Upper panel: red points (RD) are the distance of each point from the best-fit ellipse (in the normal-to-the-ellipse direction) as a function of the position angle, and the solid black line is the model with 1σ uncertainty represented in gray. Lower panel: residuals after subtracting the model from the data points.
Current usage metrics show cumulative count of Article Views (full-text article views including HTML views, PDF and ePub downloads, according to the available data) and Abstracts Views on Vision4Press platform.
Data correspond to usage on the plateform after 2015. The current usage metrics is available 48-96 hours after online publication and is updated daily on week days.
Initial download of the metrics may take a while.