Fig. 3
Download original image
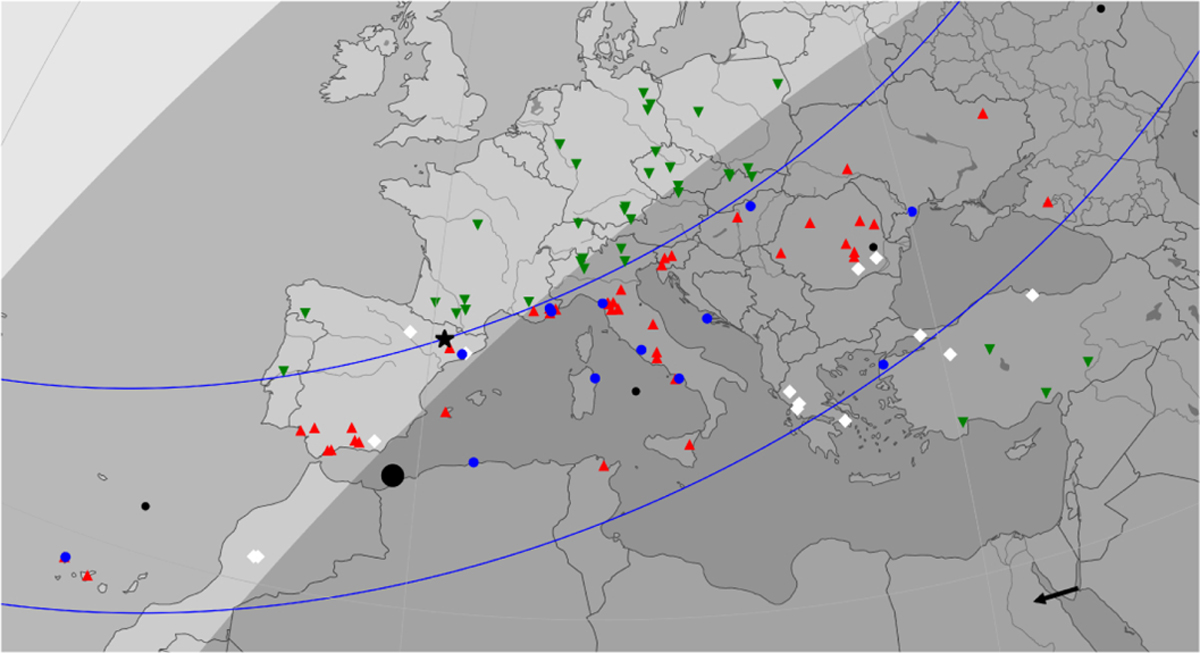
Post-occultation map showing the location of each station that participated in the 8 August 2020 occultation campaign. Solid lines delimit the observed shadow path, and the black dots mark the shadow position every minute, with the largest at the moment of the geocenter’s closest approach. The shadow follows the direction given by the black arrow. The blue dots indicate the 13 selected chords, while the other positives are in red triangles. A black star marks the close-by negative chord acquired from Montsec station. Green triangles and white diamonds represent stations with negative data and bad weather, respectively.
Current usage metrics show cumulative count of Article Views (full-text article views including HTML views, PDF and ePub downloads, according to the available data) and Abstracts Views on Vision4Press platform.
Data correspond to usage on the plateform after 2015. The current usage metrics is available 48-96 hours after online publication and is updated daily on week days.
Initial download of the metrics may take a while.