Fig. 2
Download original image
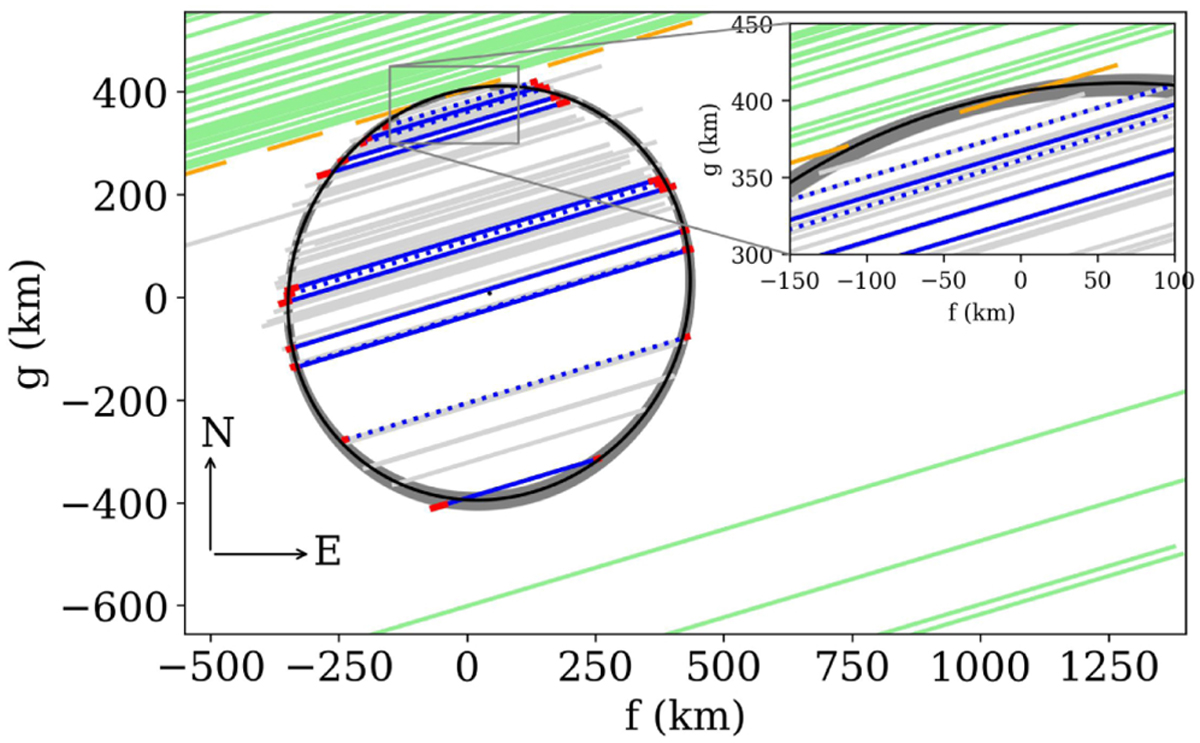
Thirteen selected chords (blue), where GPS data are presented in solid lines and NTP by dashed lines. Gray segments show the other positive chords not used in limb-fitting. The black ellipse shows the best elliptical limb, and the gray region the solutions within 3σ. The orange segments represent each image acquired from the Montsec station and the light green segments show other negative chords.
Current usage metrics show cumulative count of Article Views (full-text article views including HTML views, PDF and ePub downloads, according to the available data) and Abstracts Views on Vision4Press platform.
Data correspond to usage on the plateform after 2015. The current usage metrics is available 48-96 hours after online publication and is updated daily on week days.
Initial download of the metrics may take a while.