Fig. D.1
Download original image
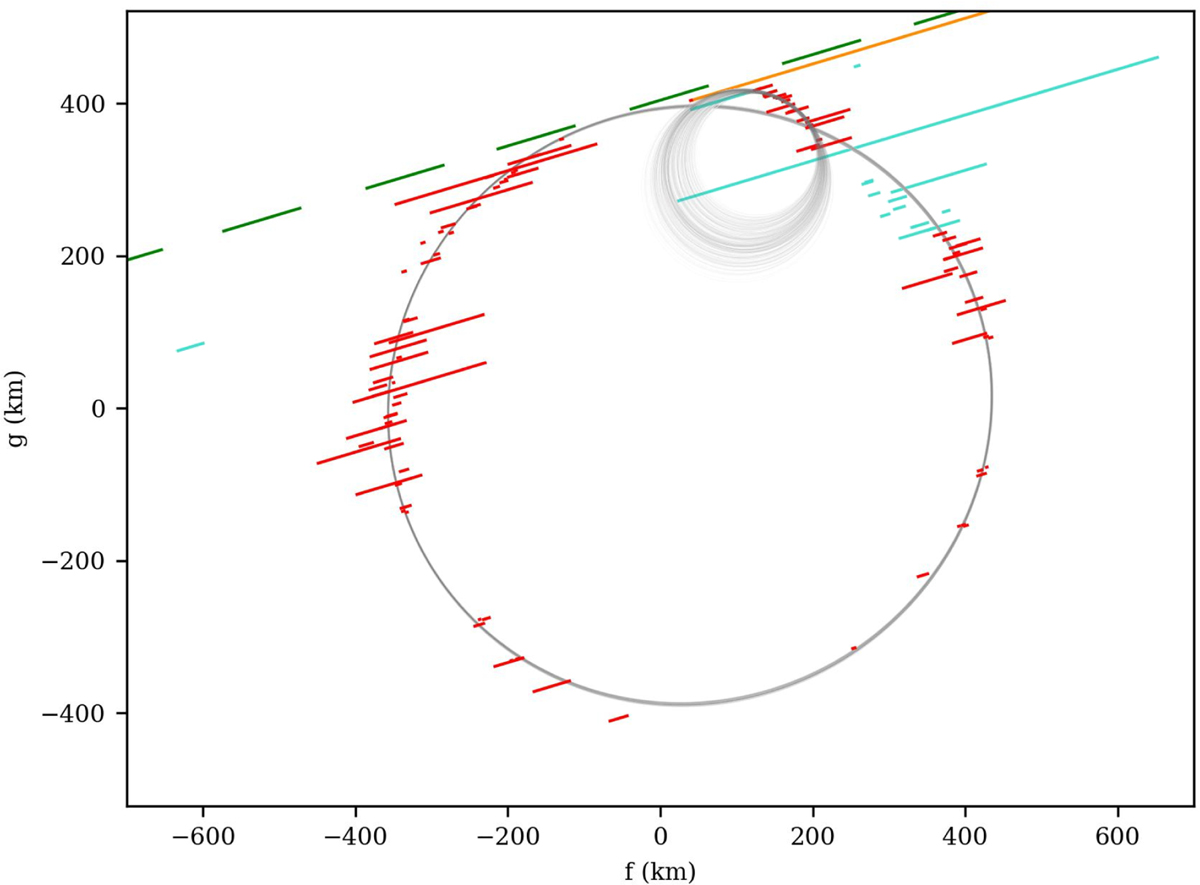
The gray regions show the 1σ fitted limb for the main body and the putative satellite. Green segments show each exposure acquired from Montsec station. This data set was the closest negative chord at North. The orange segment shows the negative part of the Varages light curve. Red segments are the observed immersion and emersion (1σ) instants used for the limb fitting. The turquoise segments are the immersion and emersion (1σ) instants not used in the fits.
Current usage metrics show cumulative count of Article Views (full-text article views including HTML views, PDF and ePub downloads, according to the available data) and Abstracts Views on Vision4Press platform.
Data correspond to usage on the plateform after 2015. The current usage metrics is available 48-96 hours after online publication and is updated daily on week days.
Initial download of the metrics may take a while.