Open Access
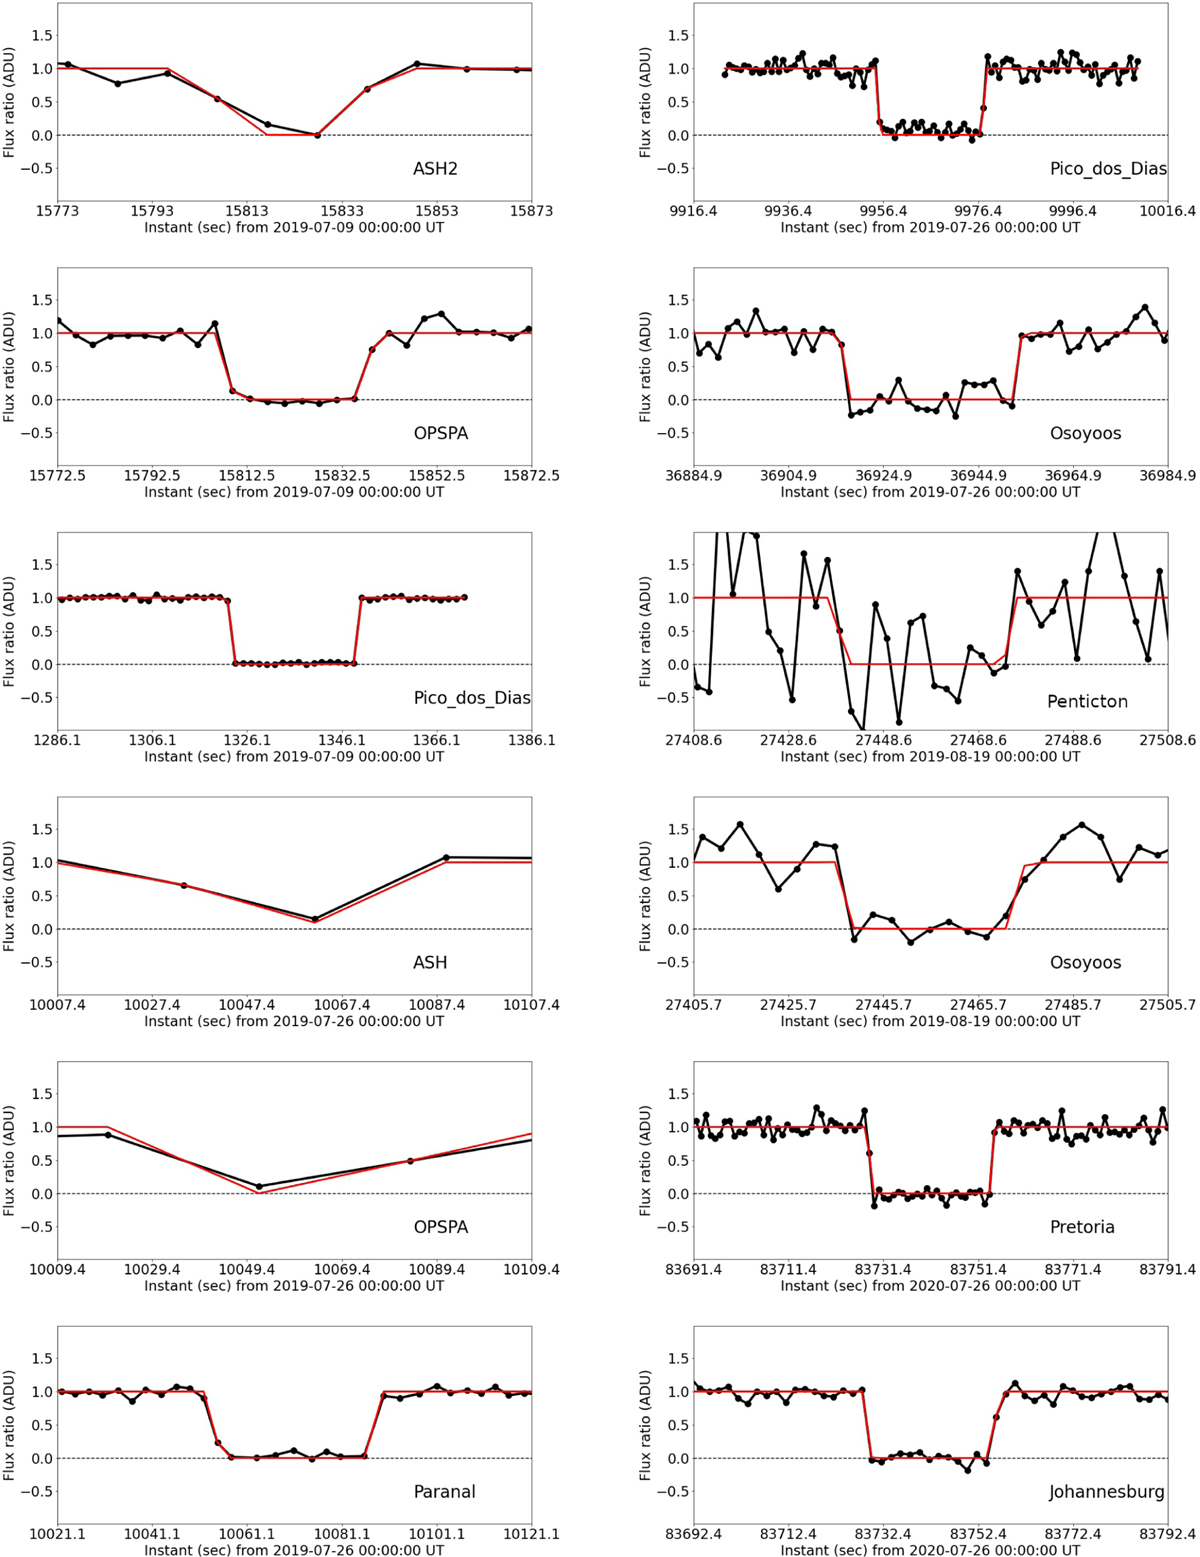
Fig. C.2
Download original image
Observed (black points) and calculated (red line) light curves for each site that observed a stellar occultation by 2002 MS4, except the 8 August 2020 multichord event. See Table B.4 for observational details.
This figure is made of several images, please see below:
Current usage metrics show cumulative count of Article Views (full-text article views including HTML views, PDF and ePub downloads, according to the available data) and Abstracts Views on Vision4Press platform.
Data correspond to usage on the plateform after 2015. The current usage metrics is available 48-96 hours after online publication and is updated daily on week days.
Initial download of the metrics may take a while.