Open Access
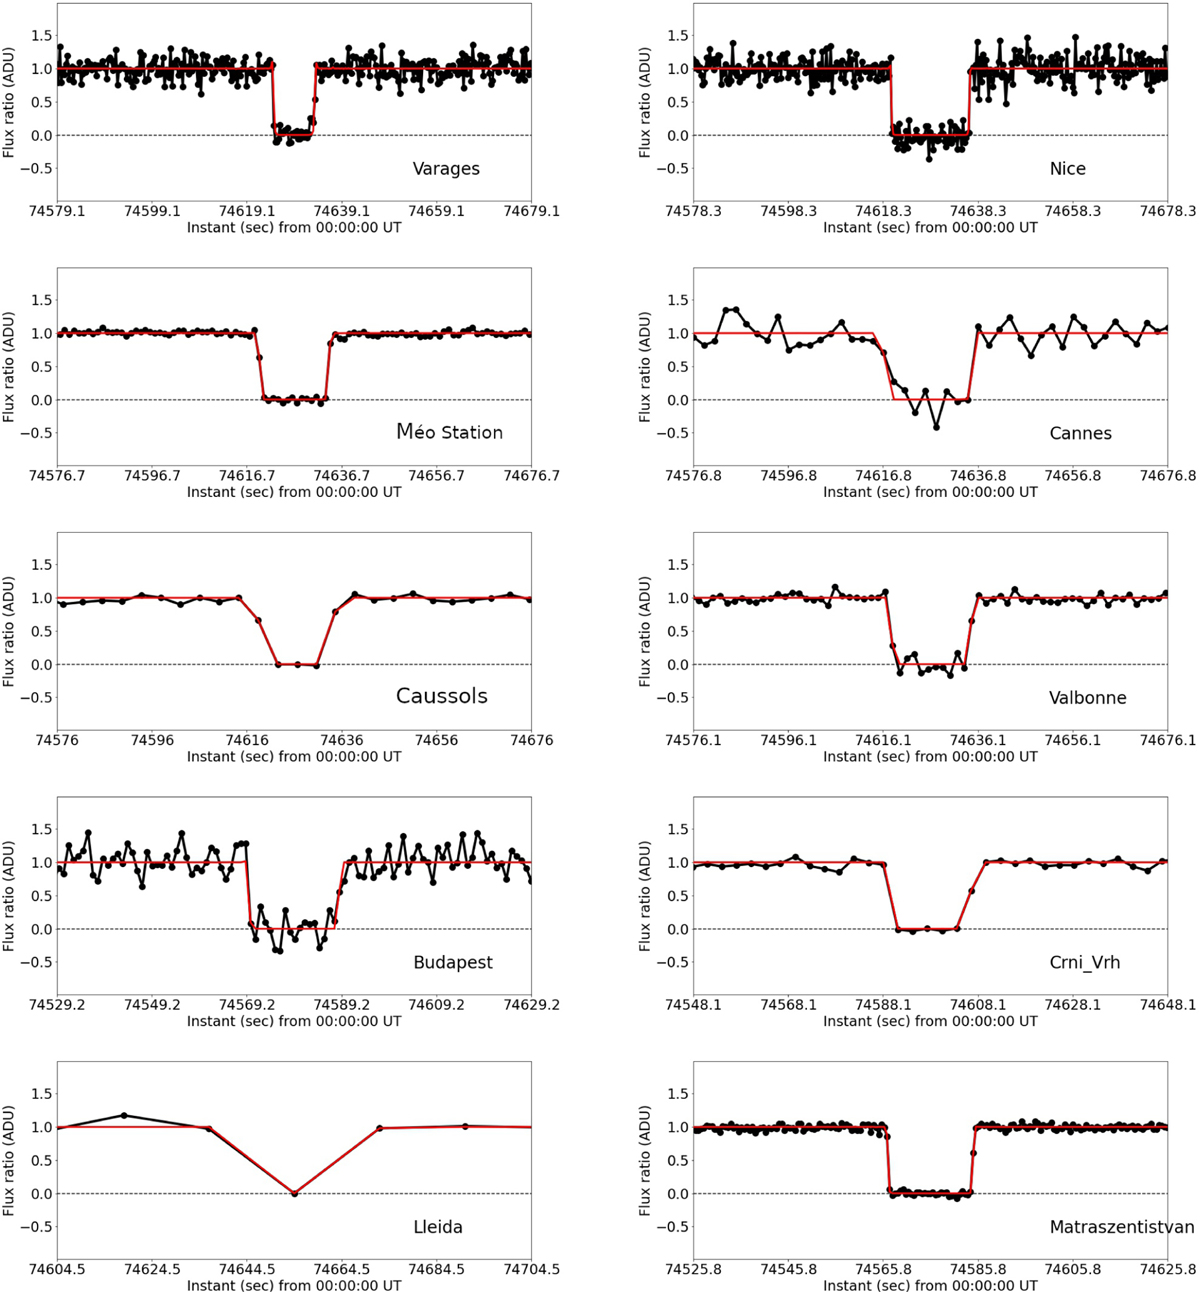
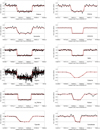
Fig. C.1
Download original image
Fifty-eight normalized light curves, centered in the occultation instant, obtained on the 8 August 2020 campaign. The station that acquired the light curve is mentioned in each plot. The black and red points present the observed data and the fitted model, respectively.
This figure is made of several images, please see below:
Current usage metrics show cumulative count of Article Views (full-text article views including HTML views, PDF and ePub downloads, according to the available data) and Abstracts Views on Vision4Press platform.
Data correspond to usage on the plateform after 2015. The current usage metrics is available 48-96 hours after online publication and is updated daily on week days.
Initial download of the metrics may take a while.