Fig. A.2
Download original image
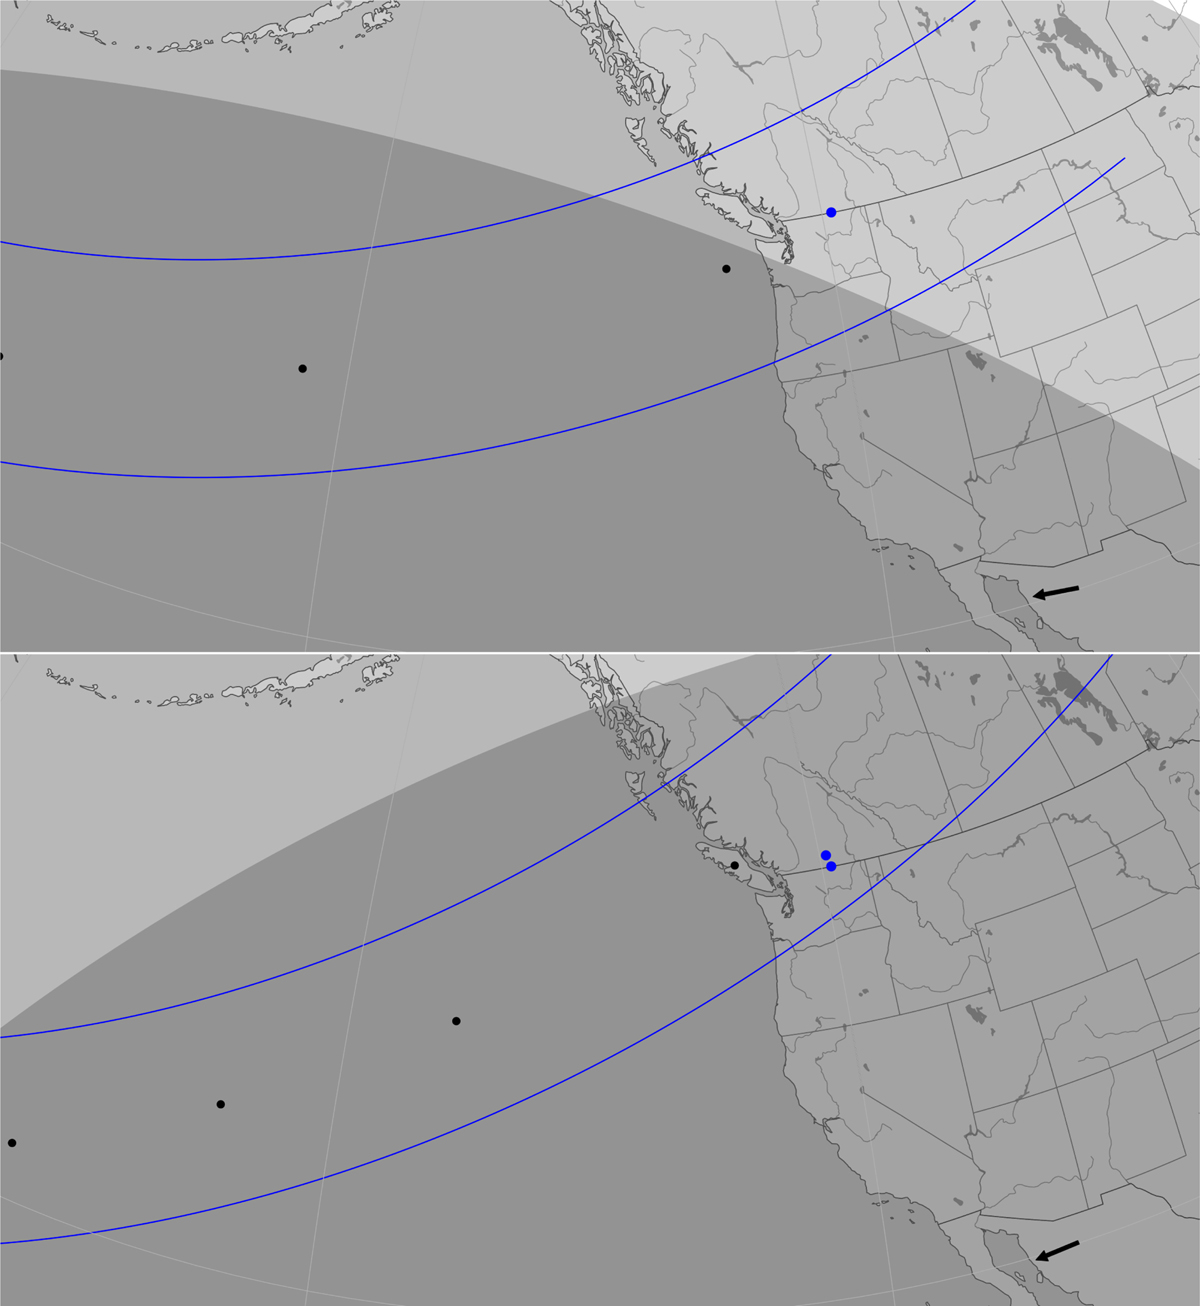
Post-occultation map of the stellar occultations observed on July 26 (upper panel) and August 19, 2019 (lower panel) from North America. Solid blue lines and black dots indicate the observed shadow path every minute. The arrow shows the shadow direction over the Earth’s surface, and the blue dots show the positive detections.
Current usage metrics show cumulative count of Article Views (full-text article views including HTML views, PDF and ePub downloads, according to the available data) and Abstracts Views on Vision4Press platform.
Data correspond to usage on the plateform after 2015. The current usage metrics is available 48-96 hours after online publication and is updated daily on week days.
Initial download of the metrics may take a while.