Fig. A.1
Download original image
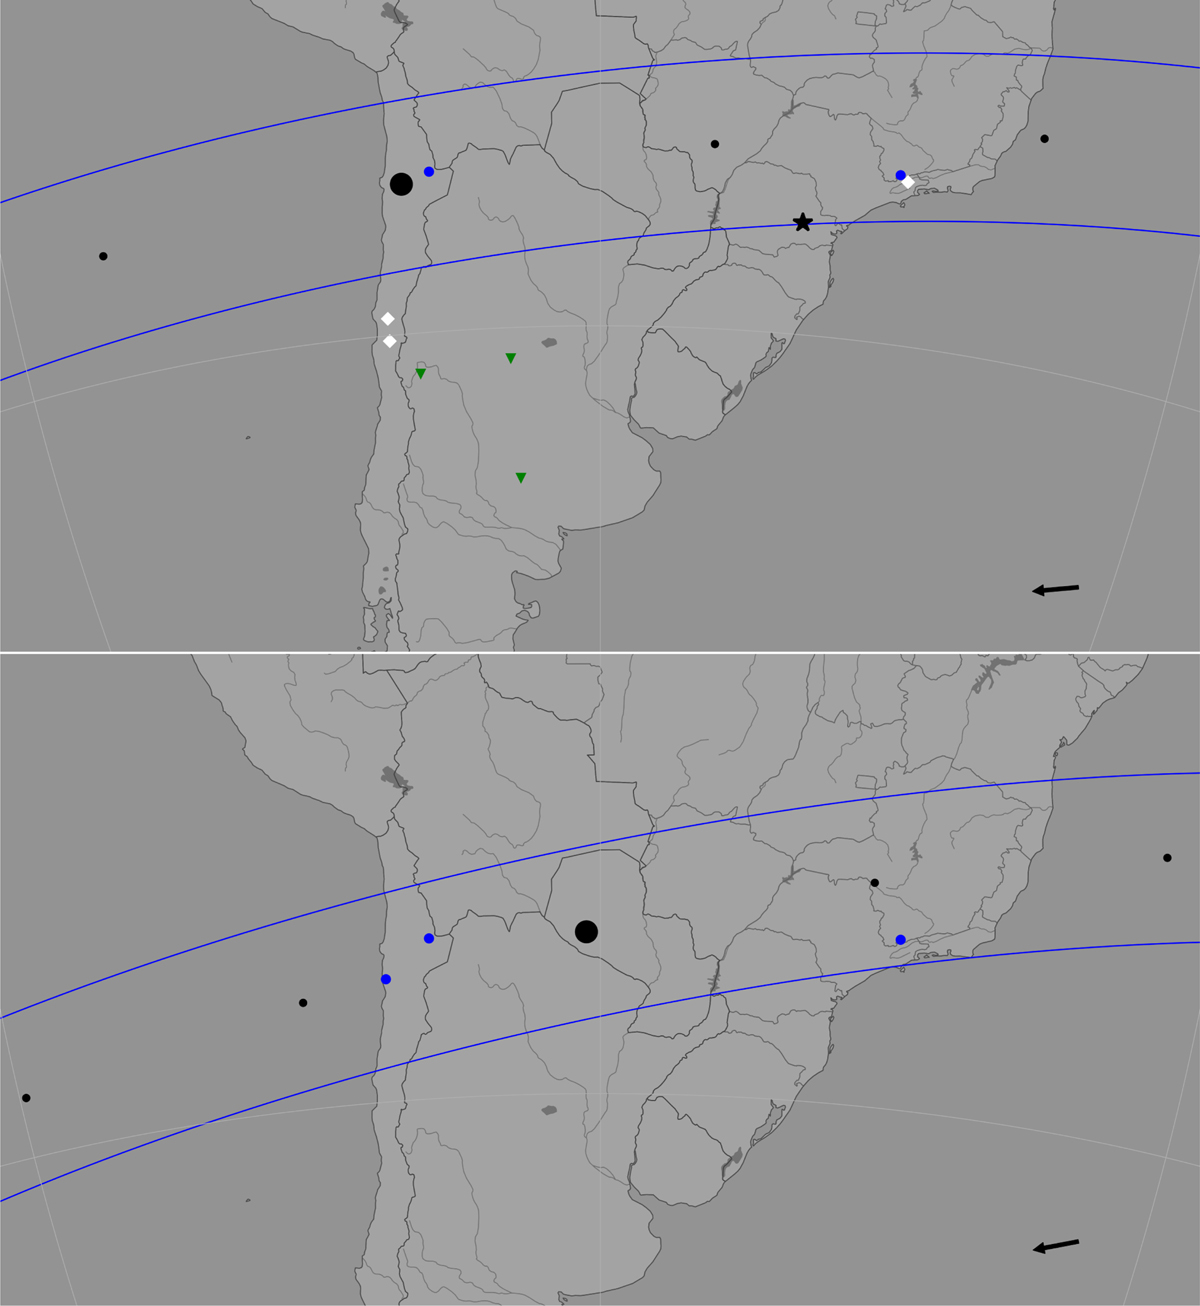
Post-occultation map of the stellar occultations observed on July 09 (upper panel) and July 26, 2019 (lower panel) from South America. Solid blue lines and black dots indicate the observed shadow path every minute, and the largest black bullet represents the closest approach instant. The arrow shows the shadow direction over the Earth’s surface. Blue dots show the positive detections, green triangles show the negatives and white diamonds show the stations with bad weather conditions or technical problems. The black star marks the Ponta Grossa station, a close negative chord that limits the ellipse solutions at the south for the July 09, 2019, event.
Current usage metrics show cumulative count of Article Views (full-text article views including HTML views, PDF and ePub downloads, according to the available data) and Abstracts Views on Vision4Press platform.
Data correspond to usage on the plateform after 2015. The current usage metrics is available 48-96 hours after online publication and is updated daily on week days.
Initial download of the metrics may take a while.