Fig. 9.
Download original image
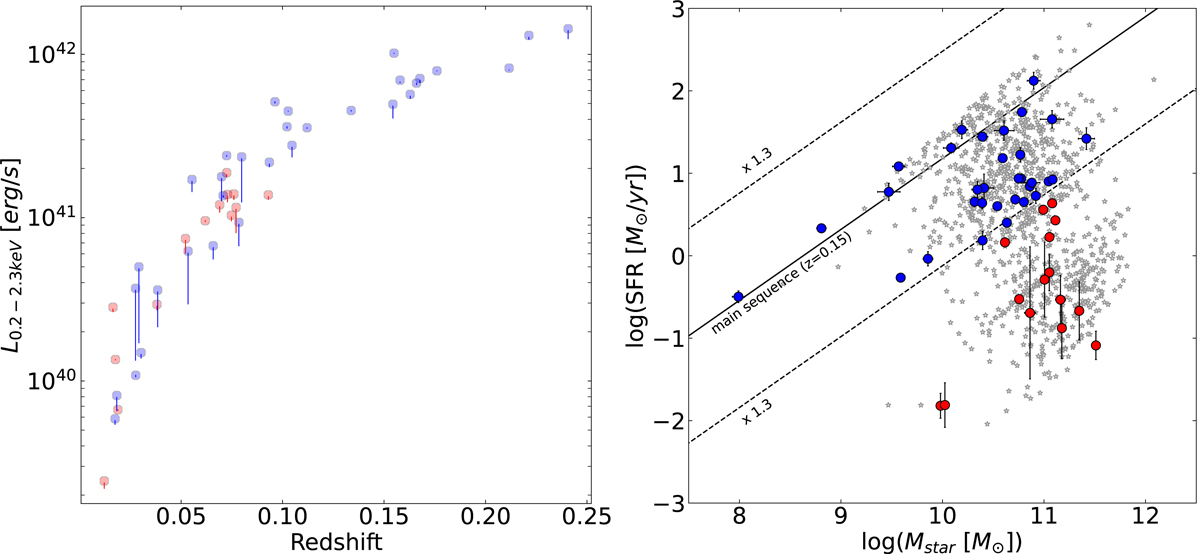
X-ray luminosity distribution over redshift for our sample of quiescent (red circles) and SFGs (blue circles) in the left panel. The uncorrected values are presented as solid circles while the change in the LX after the correction is shown by a solid line. Position of the final sample of 47 “normal galaxies” on the MS in the right panel. Quiescent galaxies are represented by red circles, while SFGs as blue circles. AGN systems are shown in grey.
Current usage metrics show cumulative count of Article Views (full-text article views including HTML views, PDF and ePub downloads, according to the available data) and Abstracts Views on Vision4Press platform.
Data correspond to usage on the plateform after 2015. The current usage metrics is available 48-96 hours after online publication and is updated daily on week days.
Initial download of the metrics may take a while.