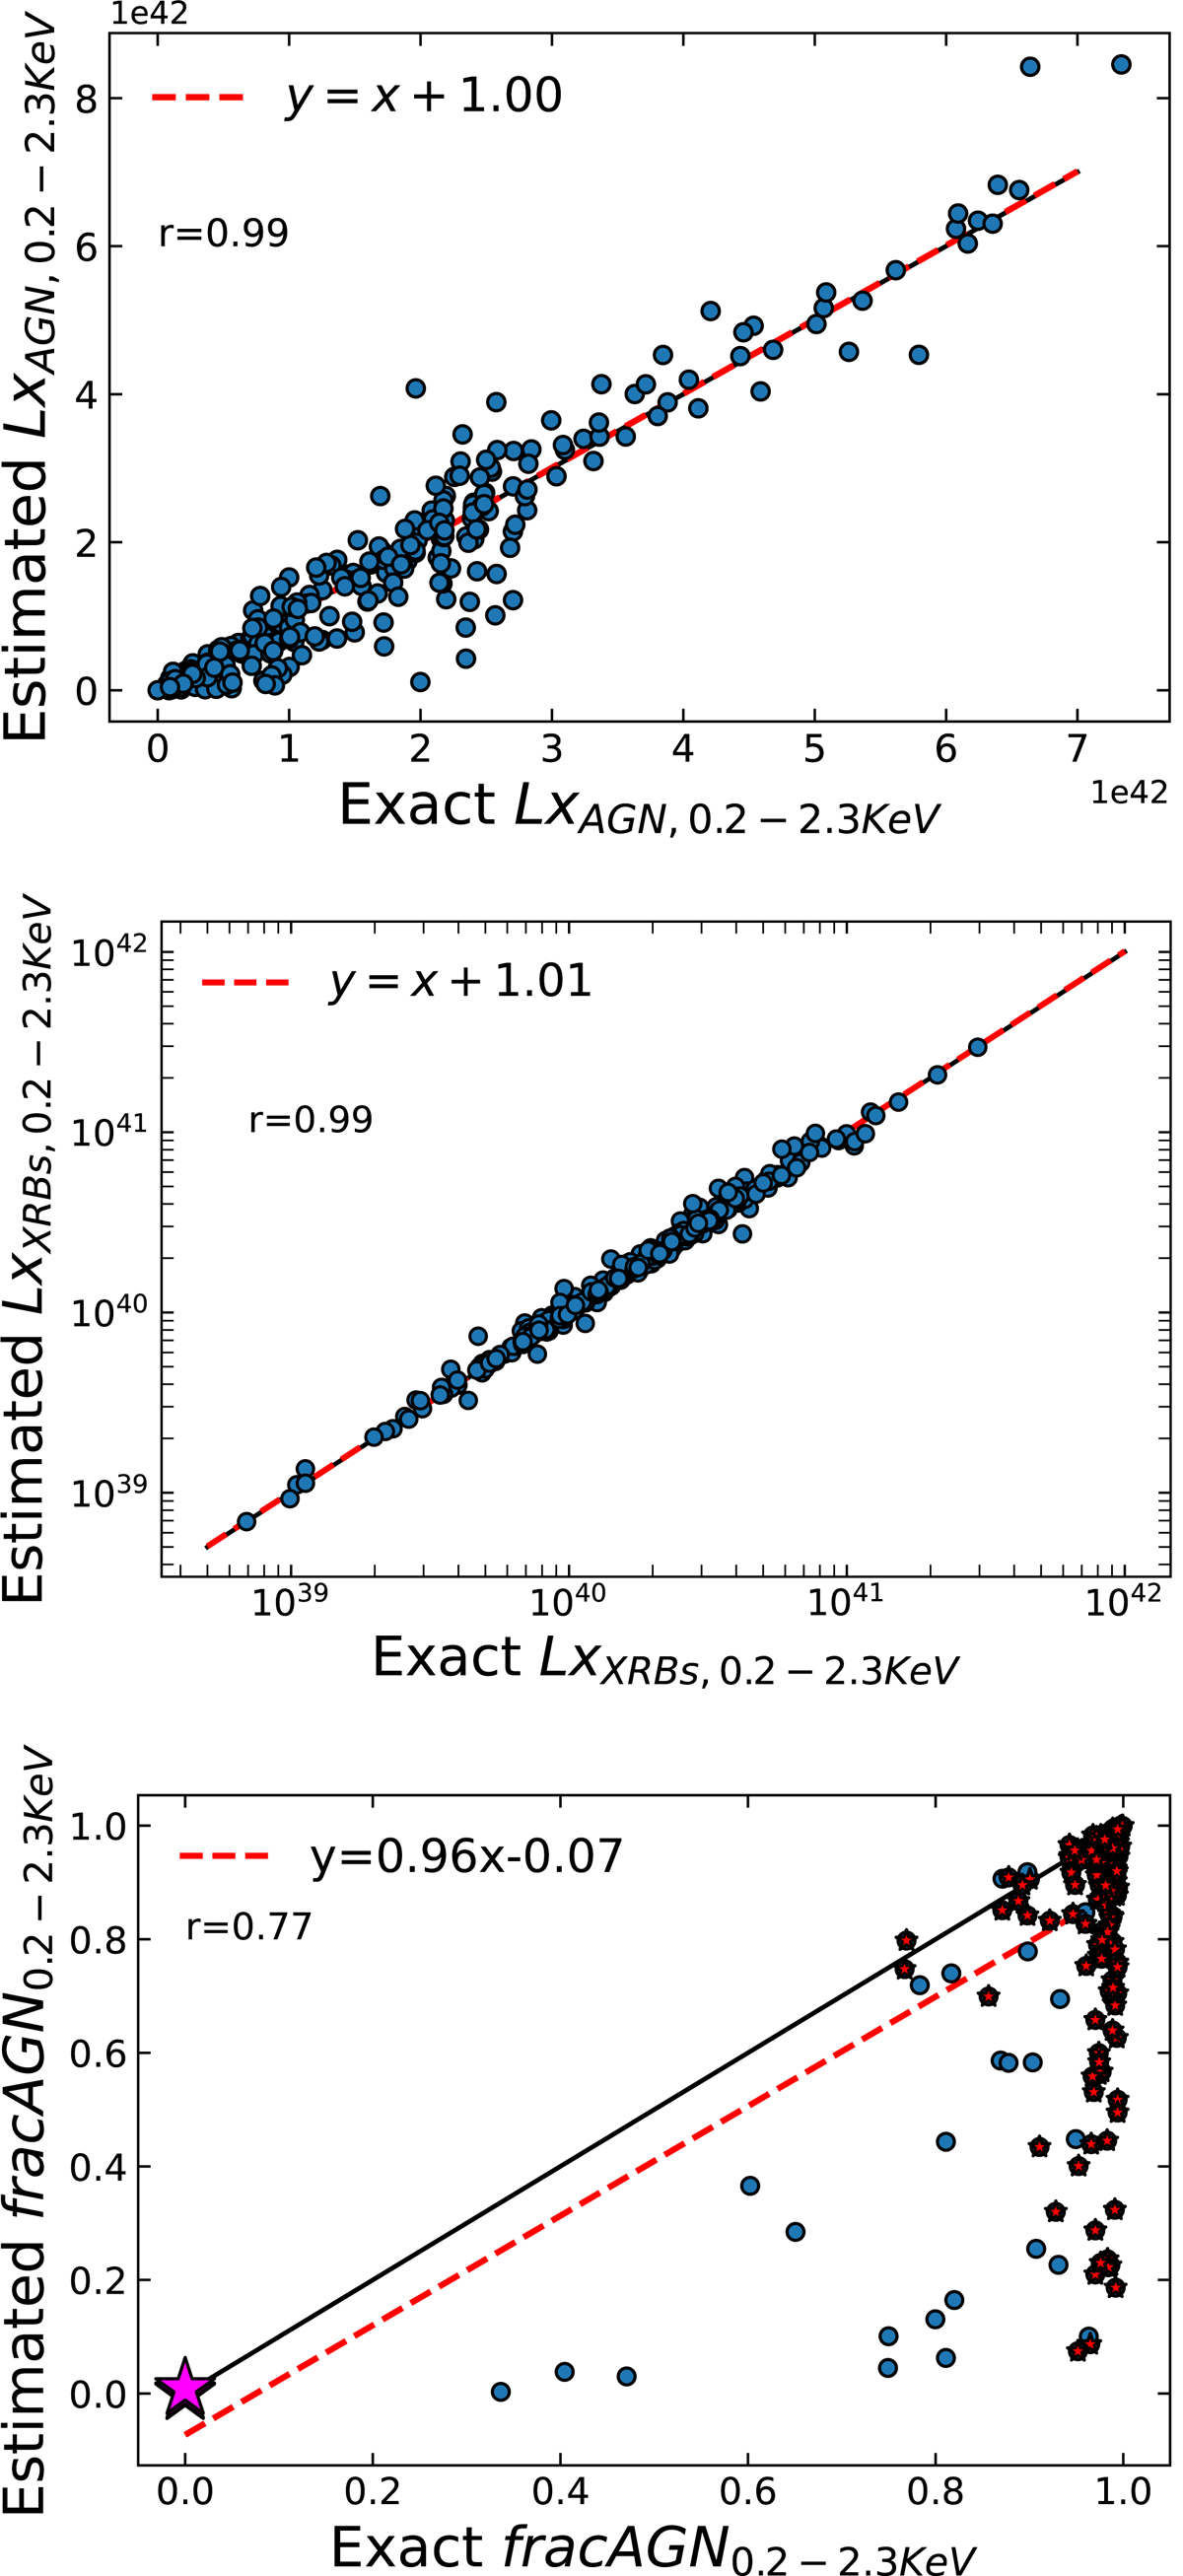
Fig. 8.
Download original image
Mock analysis for the LAGN, 0.2 − 2.3 keV (top panel), LXRB, 0.2 − 2.3 keV (middle panel), and fAGN0.2 − 2.3 keV (bottom panel). The Pearson product-moment correlation coefficient is given as an ‘r’ value. The black solid line corresponds to the 1:1 relation, while the red dashed line is the regression line with the equation given in the legend. The magenta star represents the superposition of 44 sources. The red stars are the sources having f0.25 μm > 0.1 from the initial run described in Sect. 3.
Current usage metrics show cumulative count of Article Views (full-text article views including HTML views, PDF and ePub downloads, according to the available data) and Abstracts Views on Vision4Press platform.
Data correspond to usage on the plateform after 2015. The current usage metrics is available 48-96 hours after online publication and is updated daily on week days.
Initial download of the metrics may take a while.