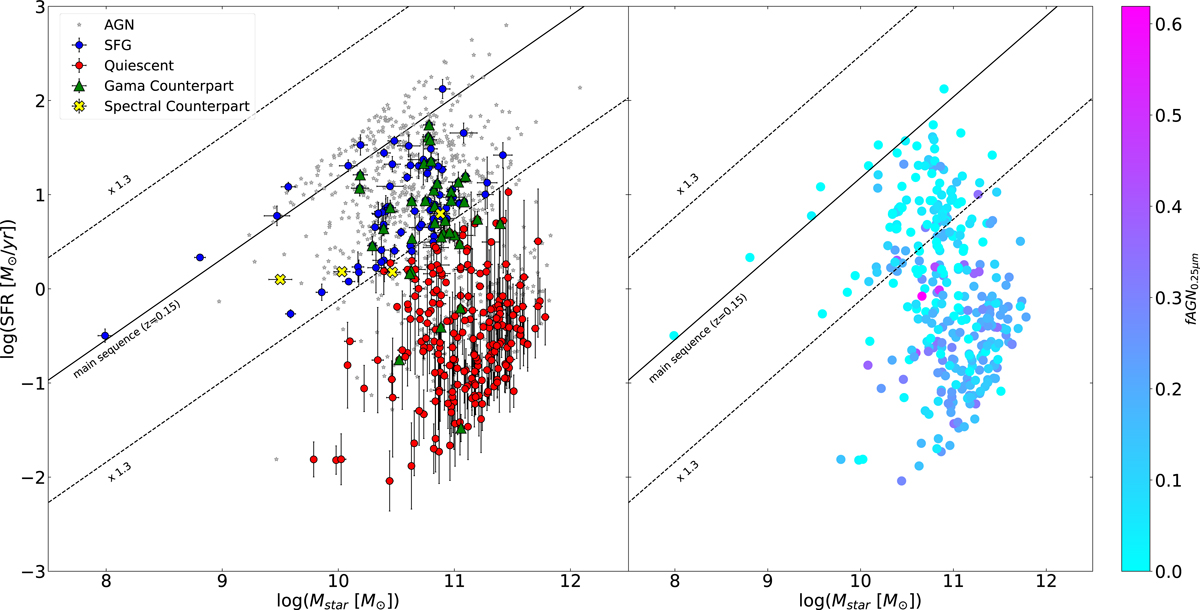
Fig. 7.
Download original image
724 galaxies from the final sample shown in the SFR–M* plot (left). Blue points represent the SFGs, red points show the location of the quiescent galaxies, and grey points the AGNs classified as described in Sect. 3.2. Right panel displays the same plot showing star-forming and quiescent galaxies color-coded by the f0.25 μm parameter. The solid black line represents the MS from Aird et al. (2017) at redshift 0.15 (the mean redshift of our sample of normal galaxies). The dashed line shows the threshold 1.3 dex above and below the MS.
Current usage metrics show cumulative count of Article Views (full-text article views including HTML views, PDF and ePub downloads, according to the available data) and Abstracts Views on Vision4Press platform.
Data correspond to usage on the plateform after 2015. The current usage metrics is available 48-96 hours after online publication and is updated daily on week days.
Initial download of the metrics may take a while.