Fig. 6.
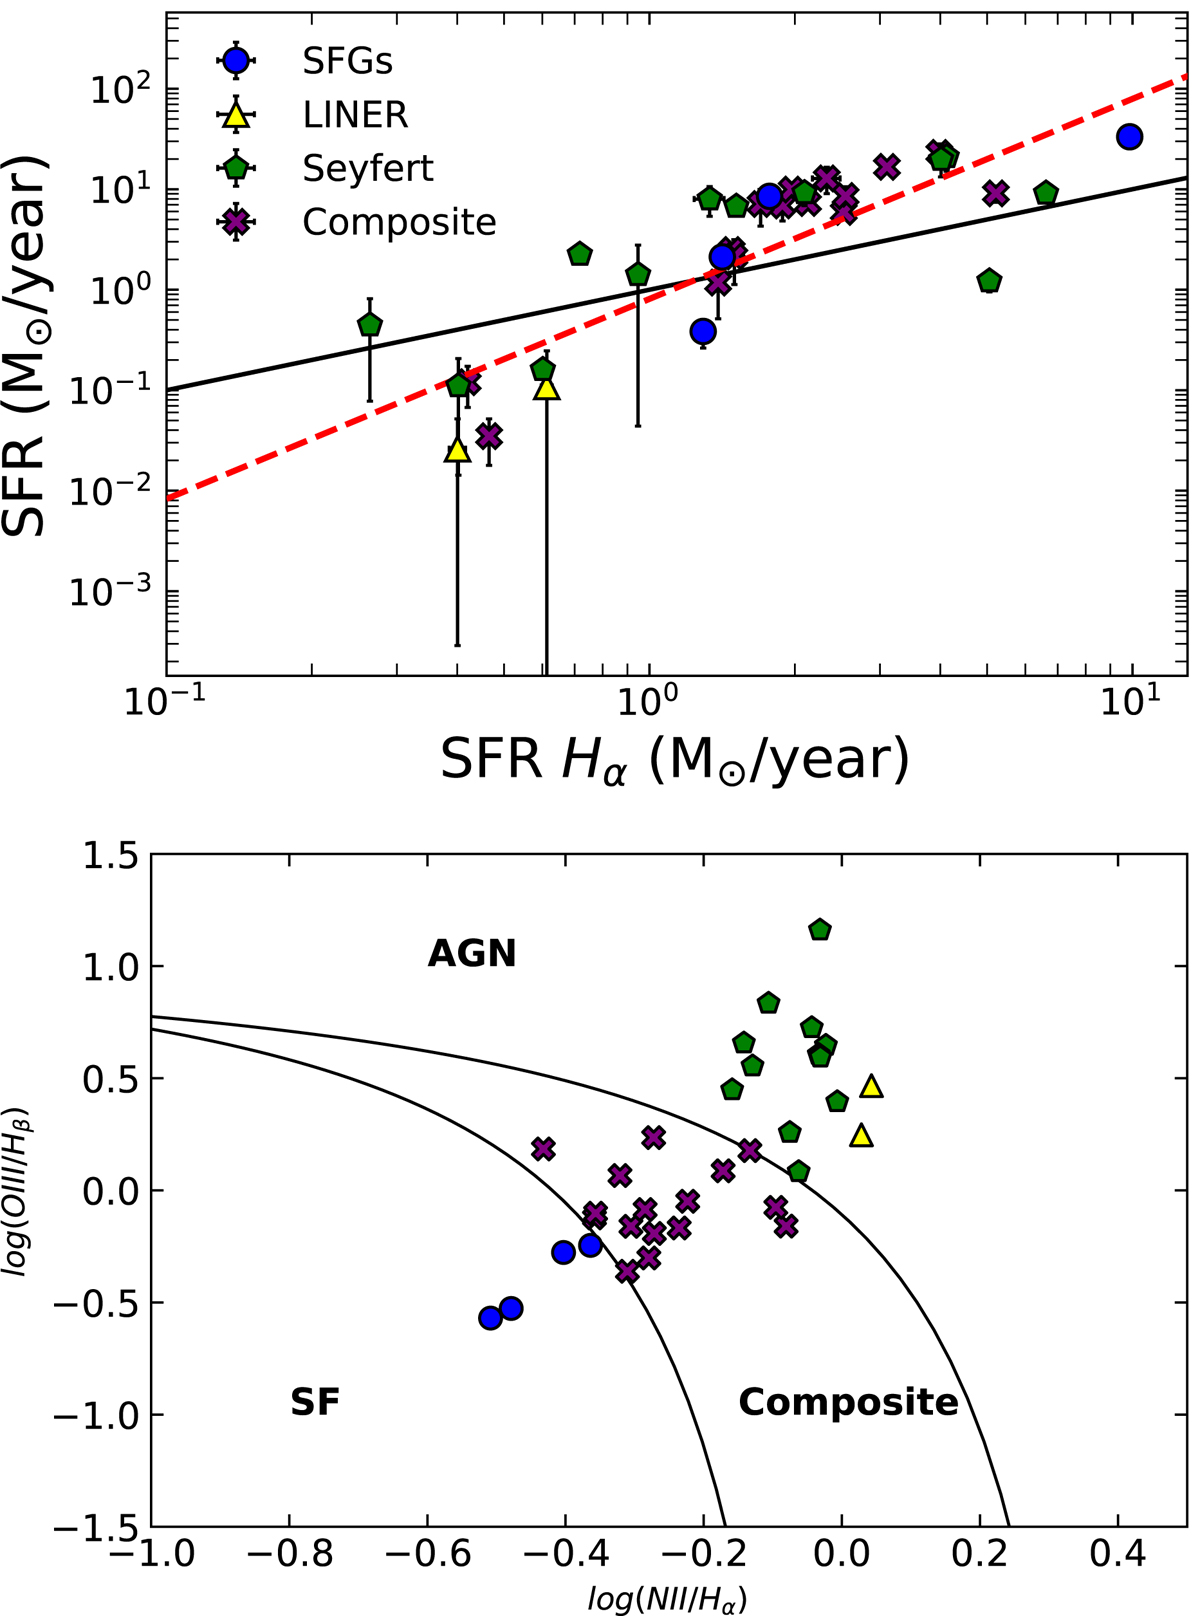
Download original image
Comparison between the SFR evaluated with the SED fitting up to WISE (y-axis) and SFR estimated using Hα lines (x-axis), shown at the top. The black solid line corresponds to the 1:1 relation, red dashed line to the linear fit of the data. Bottom panel shows one of three BPT diagrams used to select normal star-forming galaxies for the sources having spectral counterparts. The solid line delimits the division between SFG, AGNs, and composites. For both panels, the blue dots represent the SFGs, yellow triangles: LINERs, green pentagons: Seyferts, and purple crosses: composite galaxies.
Current usage metrics show cumulative count of Article Views (full-text article views including HTML views, PDF and ePub downloads, according to the available data) and Abstracts Views on Vision4Press platform.
Data correspond to usage on the plateform after 2015. The current usage metrics is available 48-96 hours after online publication and is updated daily on week days.
Initial download of the metrics may take a while.