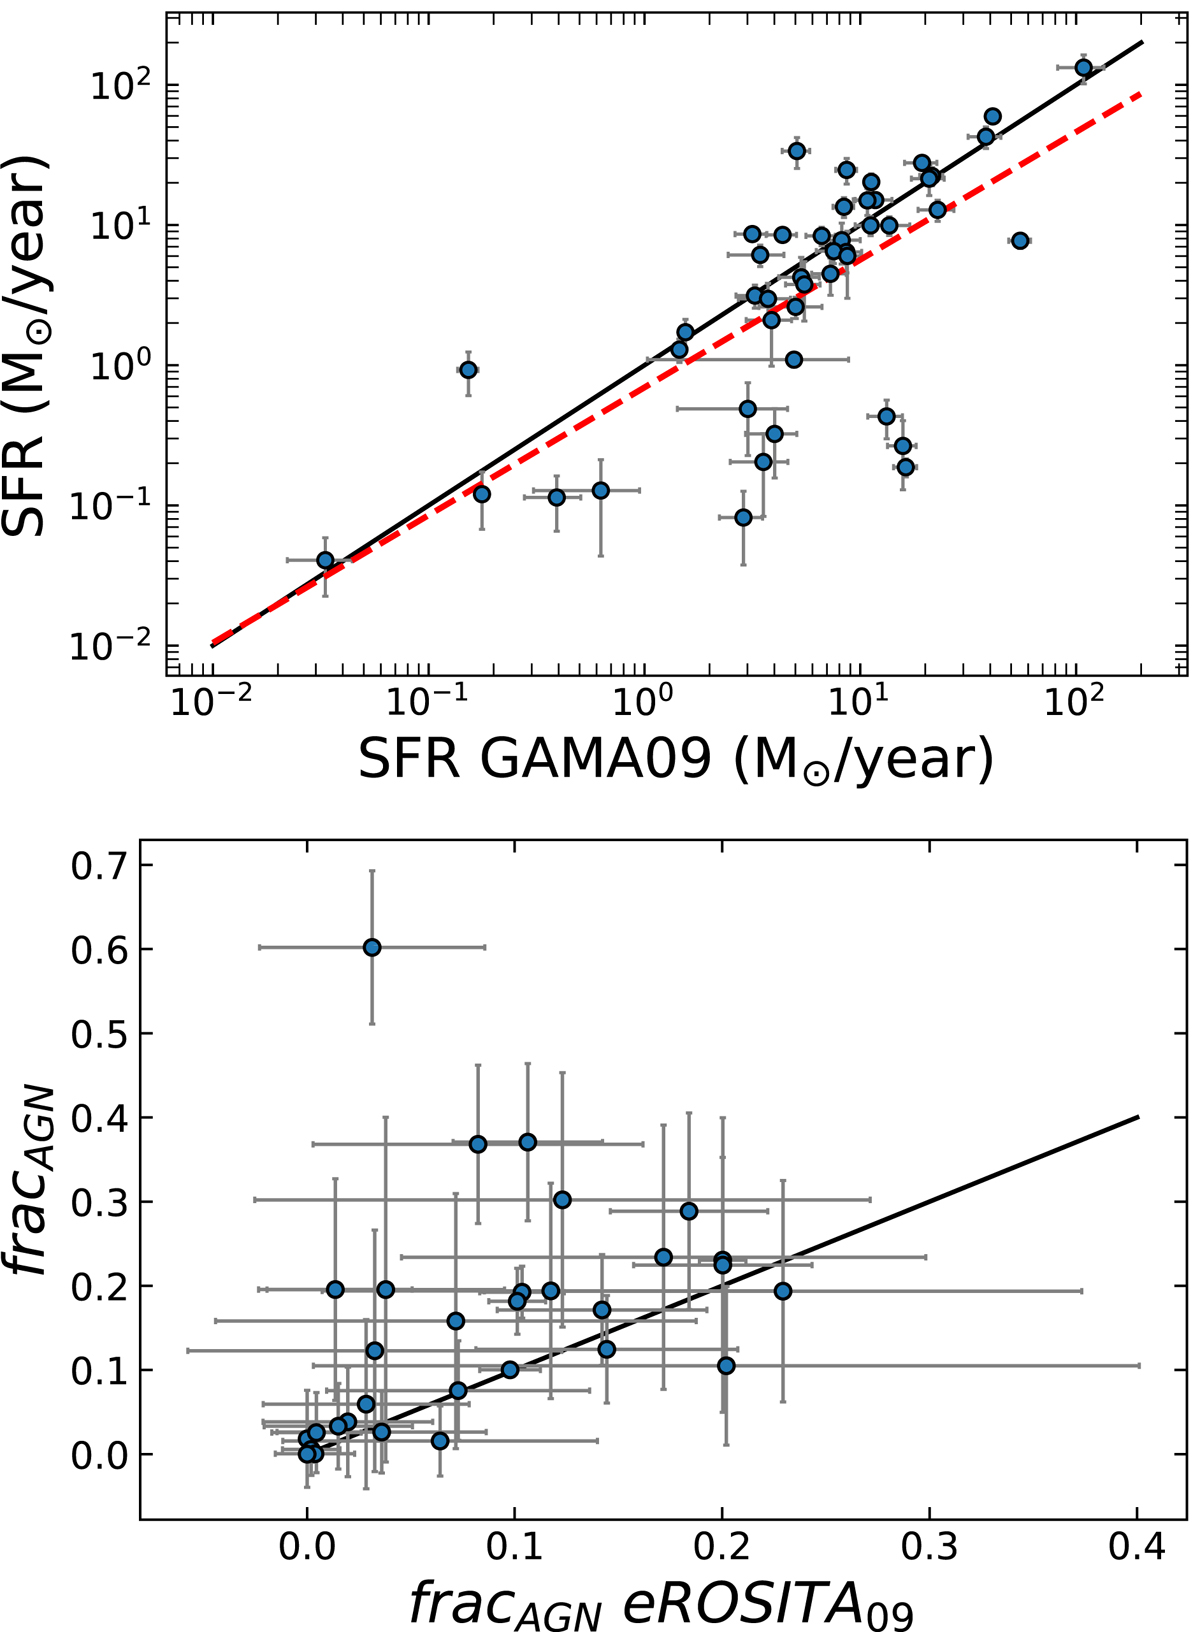
Fig. 5.
Download original image
Comparison between the SFR evaluated with data up to WISE (y-axis) and SFR estimated adding SPIRE FIR data (x-axis), shown at the top. The black solid line corresponds to the 1:1 relation, red dashed line to the linear fit of the data. Comparison between fracAGN parameter estimated by the two runs, shown at the bottom. The solid line corresponds to the 1:1 relation.
Current usage metrics show cumulative count of Article Views (full-text article views including HTML views, PDF and ePub downloads, according to the available data) and Abstracts Views on Vision4Press platform.
Data correspond to usage on the plateform after 2015. The current usage metrics is available 48-96 hours after online publication and is updated daily on week days.
Initial download of the metrics may take a while.