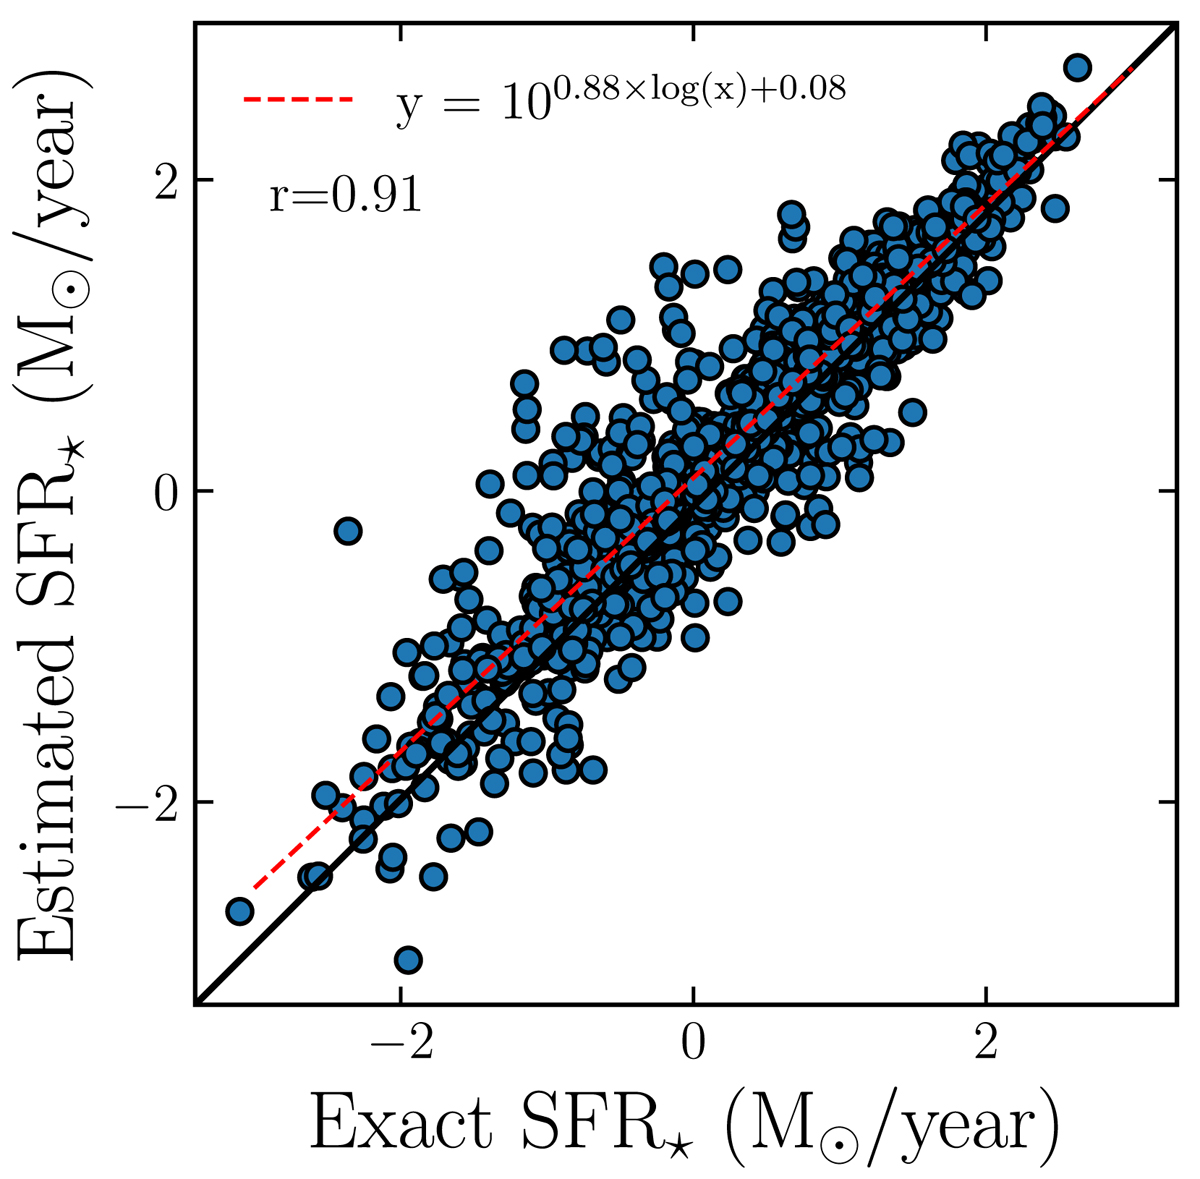
Fig. 4.
Download original image
Comparison between the true value of the SFR provided by the best-fit model for the mock catalog (x-axis) and the value estimated by the code (y-axis). The Pearson product-moment correlation coefficient is given as the ‘r’ value. The black line corresponds to the 1:1 relation, while the red dashed line is the regression line with the equation given in the legend.
Current usage metrics show cumulative count of Article Views (full-text article views including HTML views, PDF and ePub downloads, according to the available data) and Abstracts Views on Vision4Press platform.
Data correspond to usage on the plateform after 2015. The current usage metrics is available 48-96 hours after online publication and is updated daily on week days.
Initial download of the metrics may take a while.