Fig. 2.
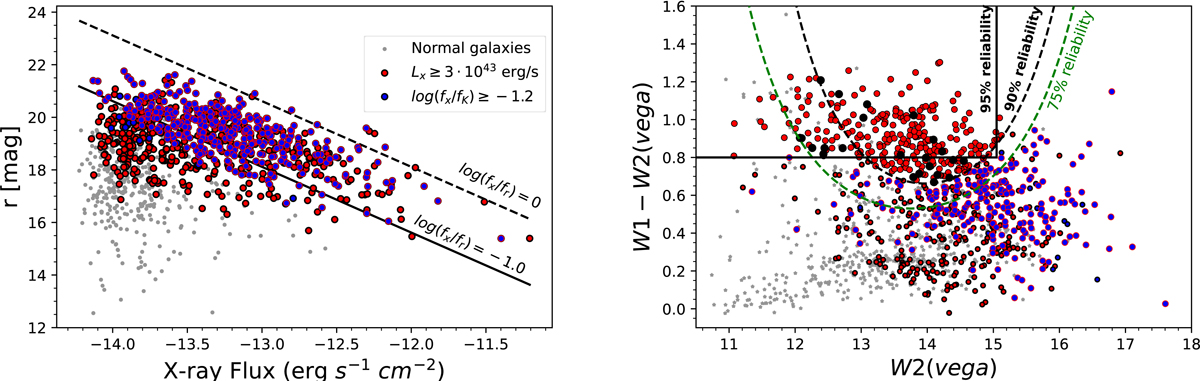
Download original image
Optical r-band AB magnitude vs. the X-ray flux for the final selected sample, shown on the left. Diagonal lines indicate a constant flux ratio between the r-band and X-ray. WISE1–WISE2 color vs. WISE2-band VEGA magnitude, shown on the right. The lines represent the MIR WISE selection criteria, 95% reliability (solid line), 90% reliability (dashed black line), and 75% reliability (dashed green), respectively. Black circles represent the WISE-selected AGNs in this work. For all panels, the grey circles represent the normal galaxies, the red circles the X-ray luminosity selected AGN, blue circles the K band selected AGNs.
Current usage metrics show cumulative count of Article Views (full-text article views including HTML views, PDF and ePub downloads, according to the available data) and Abstracts Views on Vision4Press platform.
Data correspond to usage on the plateform after 2015. The current usage metrics is available 48-96 hours after online publication and is updated daily on week days.
Initial download of the metrics may take a while.