Fig. 15.
Download original image
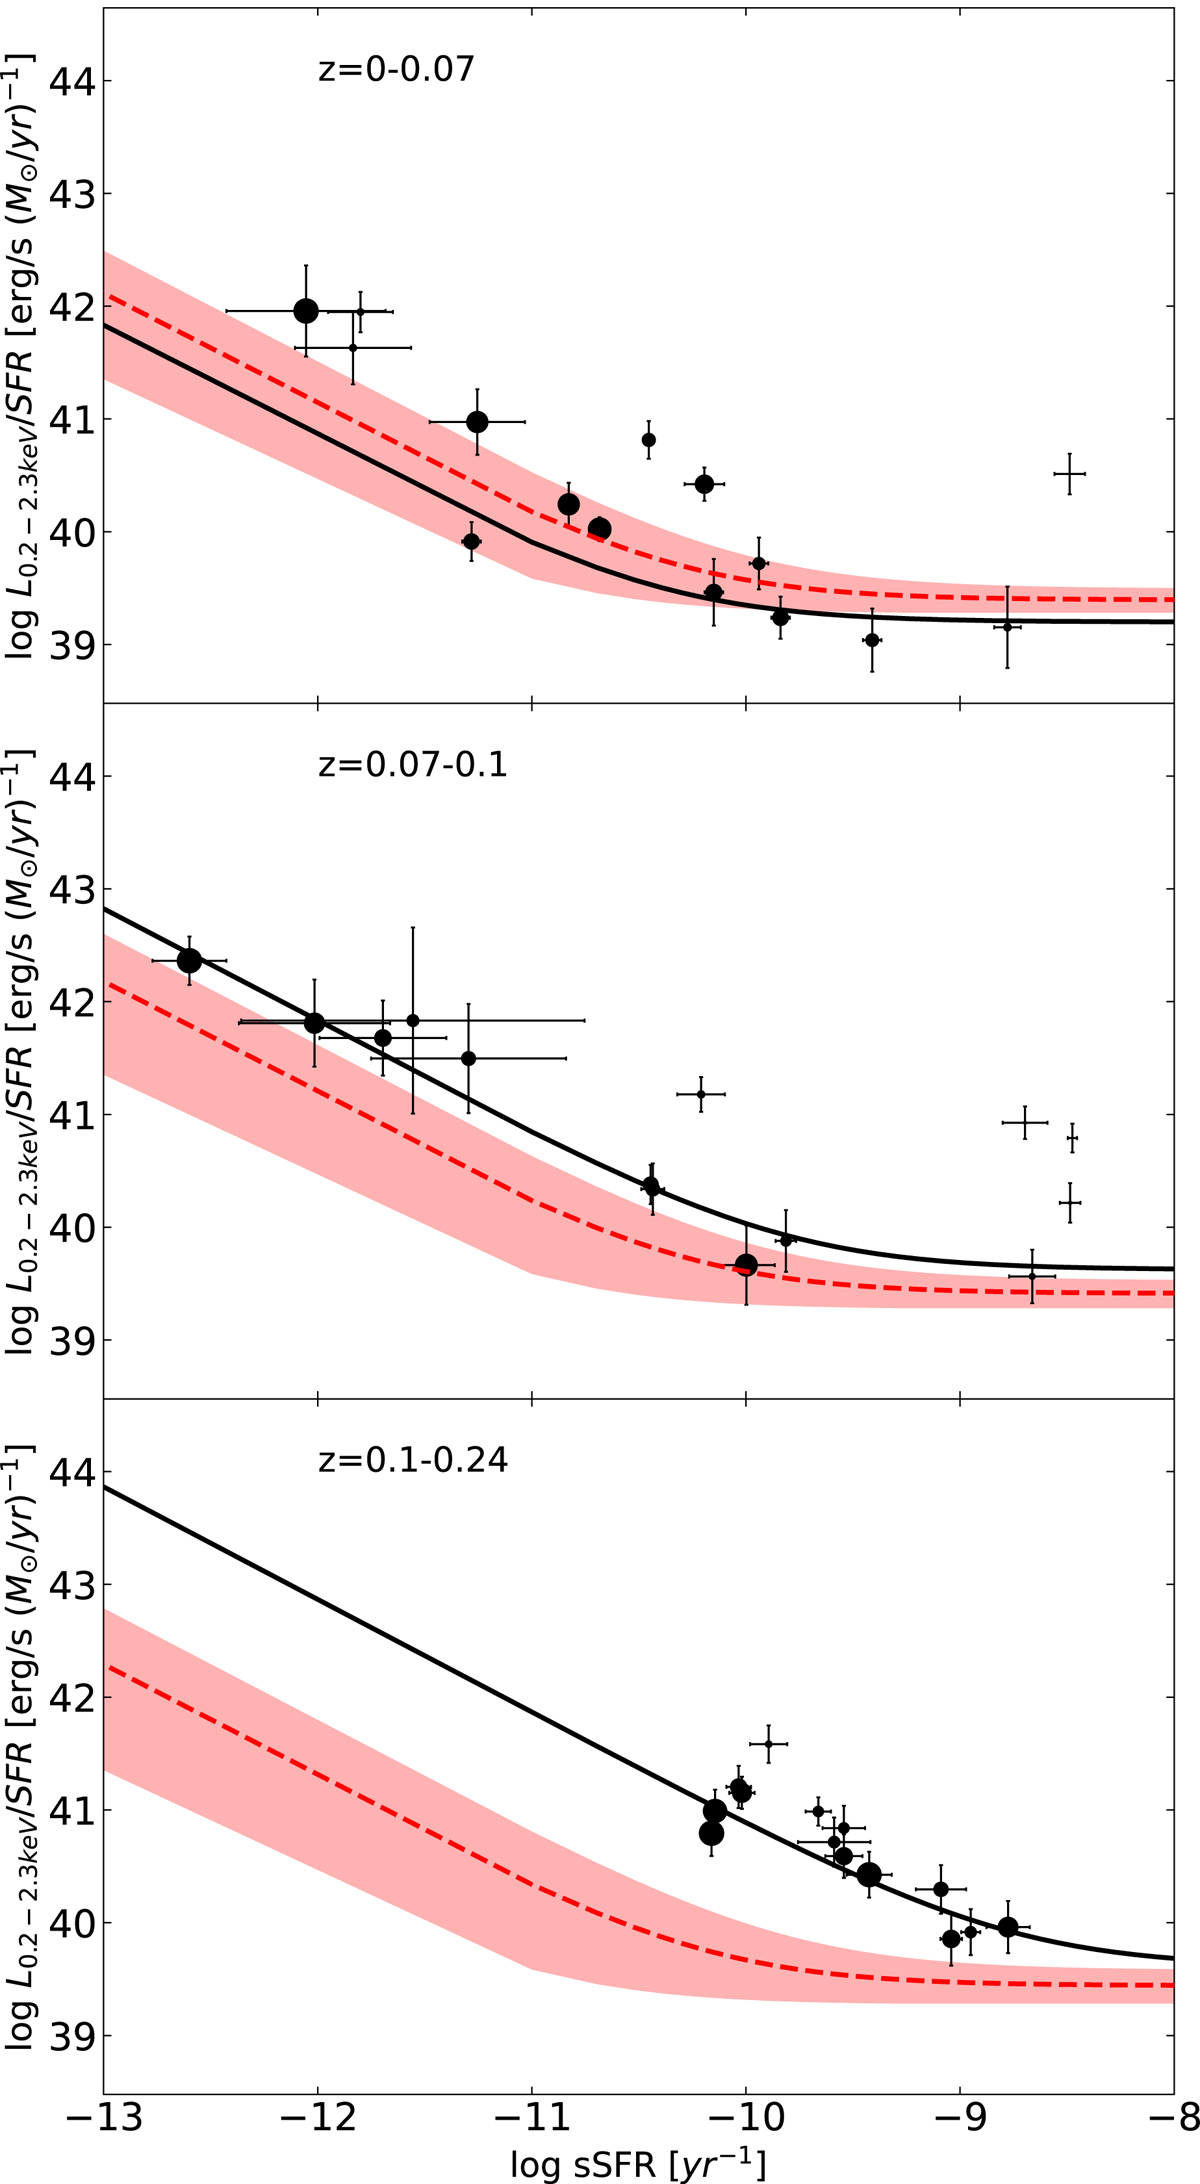
X-ray luminosity in the 0.2−2.3 keV band scaled by the SFR in the function of the sSFR for the full sample of normal galaxies divided into three redshift bins. The points size is proportional to the Mstar. The solid black lines represent the observed fit of the sources, while the red dashed lines represent Lehmer et al. (2016) relation estimated at the mean value of the redshift for each bin. The shaded red region represents the 3σ dispersion.
Current usage metrics show cumulative count of Article Views (full-text article views including HTML views, PDF and ePub downloads, according to the available data) and Abstracts Views on Vision4Press platform.
Data correspond to usage on the plateform after 2015. The current usage metrics is available 48-96 hours after online publication and is updated daily on week days.
Initial download of the metrics may take a while.