Fig. 14.
Download original image
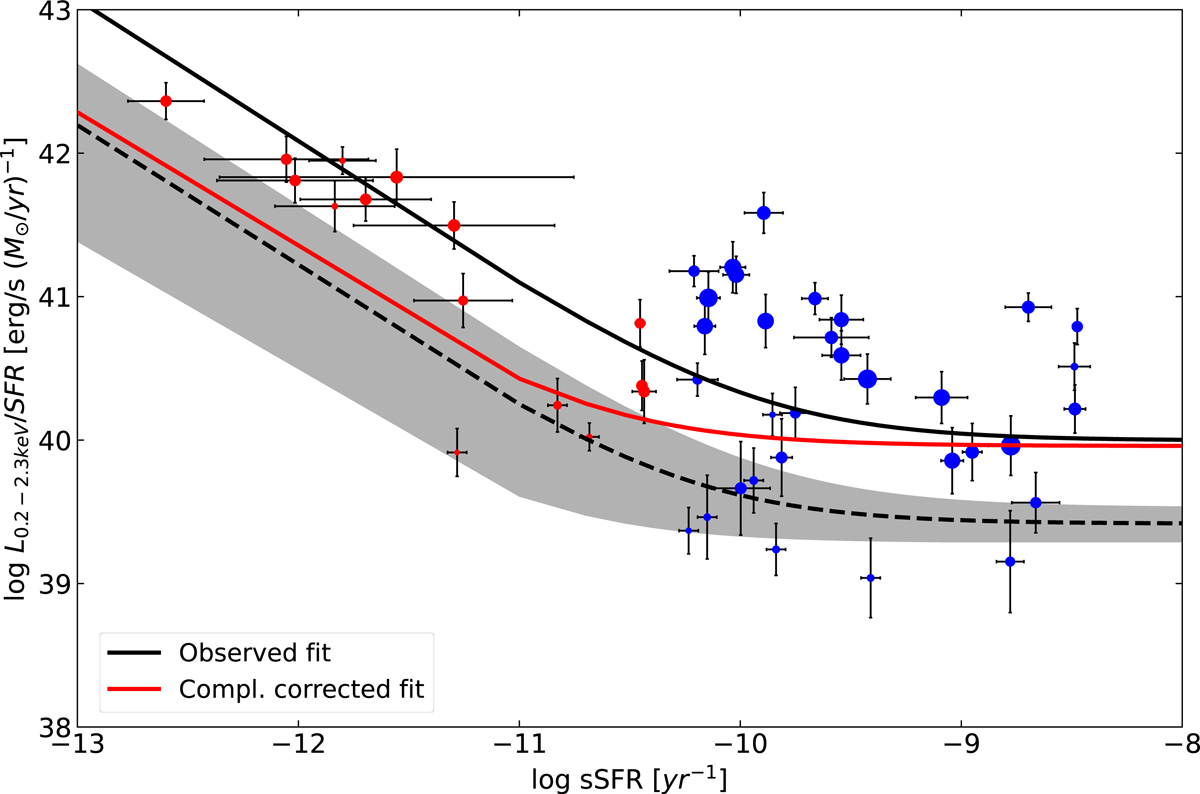
X-ray luminosity in the 0.2−2.3 keV band scaled by the SFR in the function of the sSFR for the full sample of normal galaxies, selected in this work, both quiescent (red dots) and SFGs (blue dots). The solid black line represents the observed fit of the sources, while the red solid line represents the completeness corrected fit. Lehmer et al. (2016) fit at z = 0.09 is pictured as a black dashed line, with the shaded region representing the 3σ dispersion. The size of the dots scales with the redshift of the sources Sect. 6.
Current usage metrics show cumulative count of Article Views (full-text article views including HTML views, PDF and ePub downloads, according to the available data) and Abstracts Views on Vision4Press platform.
Data correspond to usage on the plateform after 2015. The current usage metrics is available 48-96 hours after online publication and is updated daily on week days.
Initial download of the metrics may take a while.