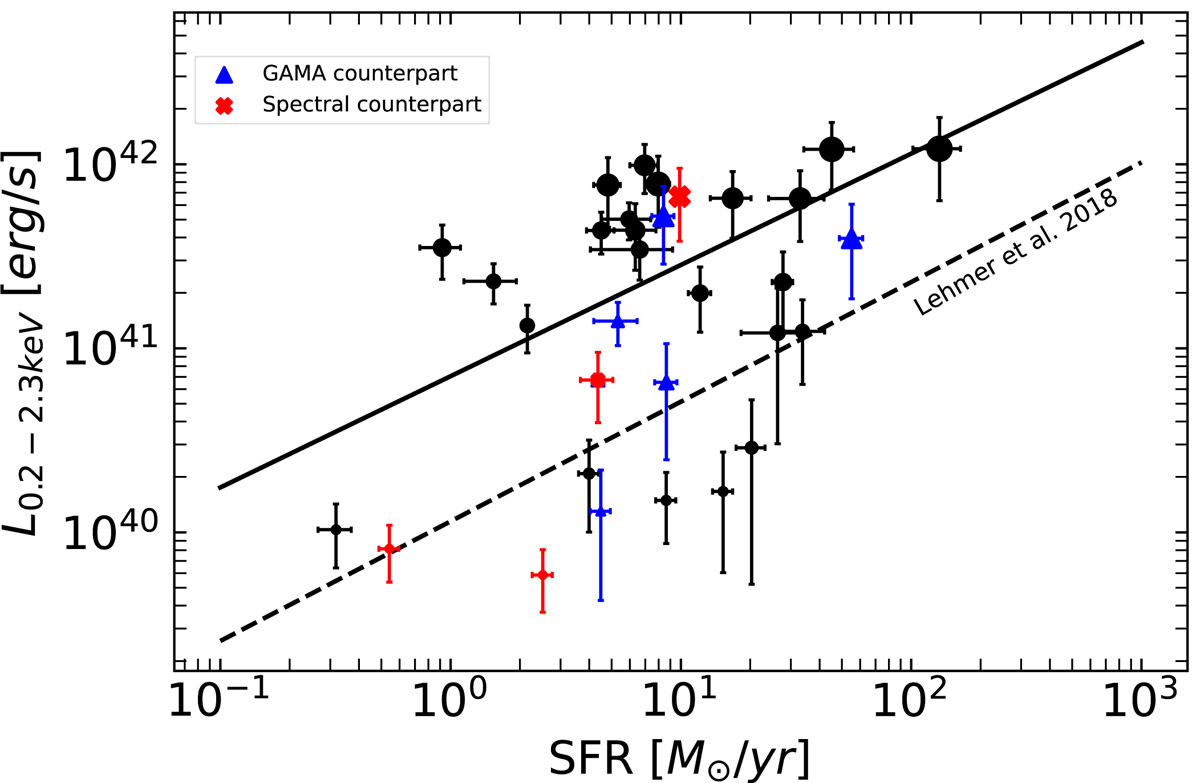
Fig. 10.
Download original image
X-ray luminosity as a function of the SFR. Black dots represent the full sample of SFGs. Red crosses and blue triangles represent the sources having Herschel and SDSS counterparts respectively. The solid black line represents the fit of our sample of data, while Lehmer et al. (2016) scaling relation is represented by the dashed black line. The size of the dots is proportional to the redshift of the sources.
Current usage metrics show cumulative count of Article Views (full-text article views including HTML views, PDF and ePub downloads, according to the available data) and Abstracts Views on Vision4Press platform.
Data correspond to usage on the plateform after 2015. The current usage metrics is available 48-96 hours after online publication and is updated daily on week days.
Initial download of the metrics may take a while.