Fig. A.1
Download original image
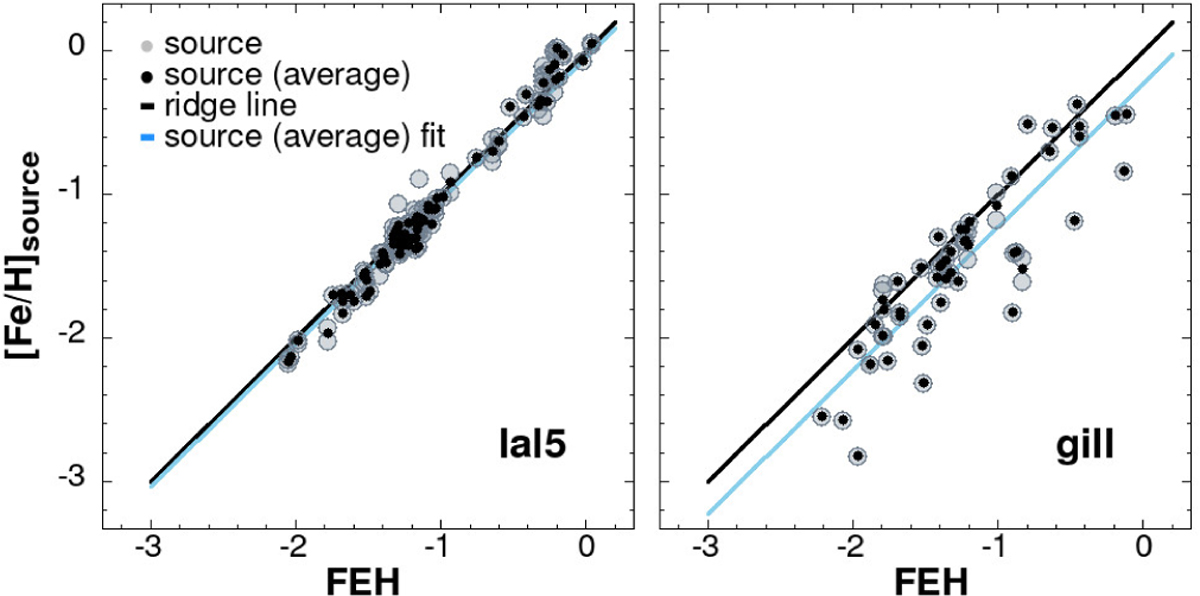
Source-dependent individual vs ridge metallicities (FEH, averages computed from all sources). Black line shows the ridge, blue line shows the fit to the particular source averages (assuming only a constant shift relative to the ridge line for a given source). Black dots are for the average metallicities, pale, larger circles are for the individual metallicities. The left and right panels show, respectively, the well-fit case of Luo et al. (in prep.) (LAMOST DR5) and the poor-fit case of Gilligan et al. (2021). The latter is not included in our final HDS sample. Table 1 gives the list of the HDS sources.
Current usage metrics show cumulative count of Article Views (full-text article views including HTML views, PDF and ePub downloads, according to the available data) and Abstracts Views on Vision4Press platform.
Data correspond to usage on the plateform after 2015. The current usage metrics is available 48-96 hours after online publication and is updated daily on week days.
Initial download of the metrics may take a while.