Fig. 4
Download original image
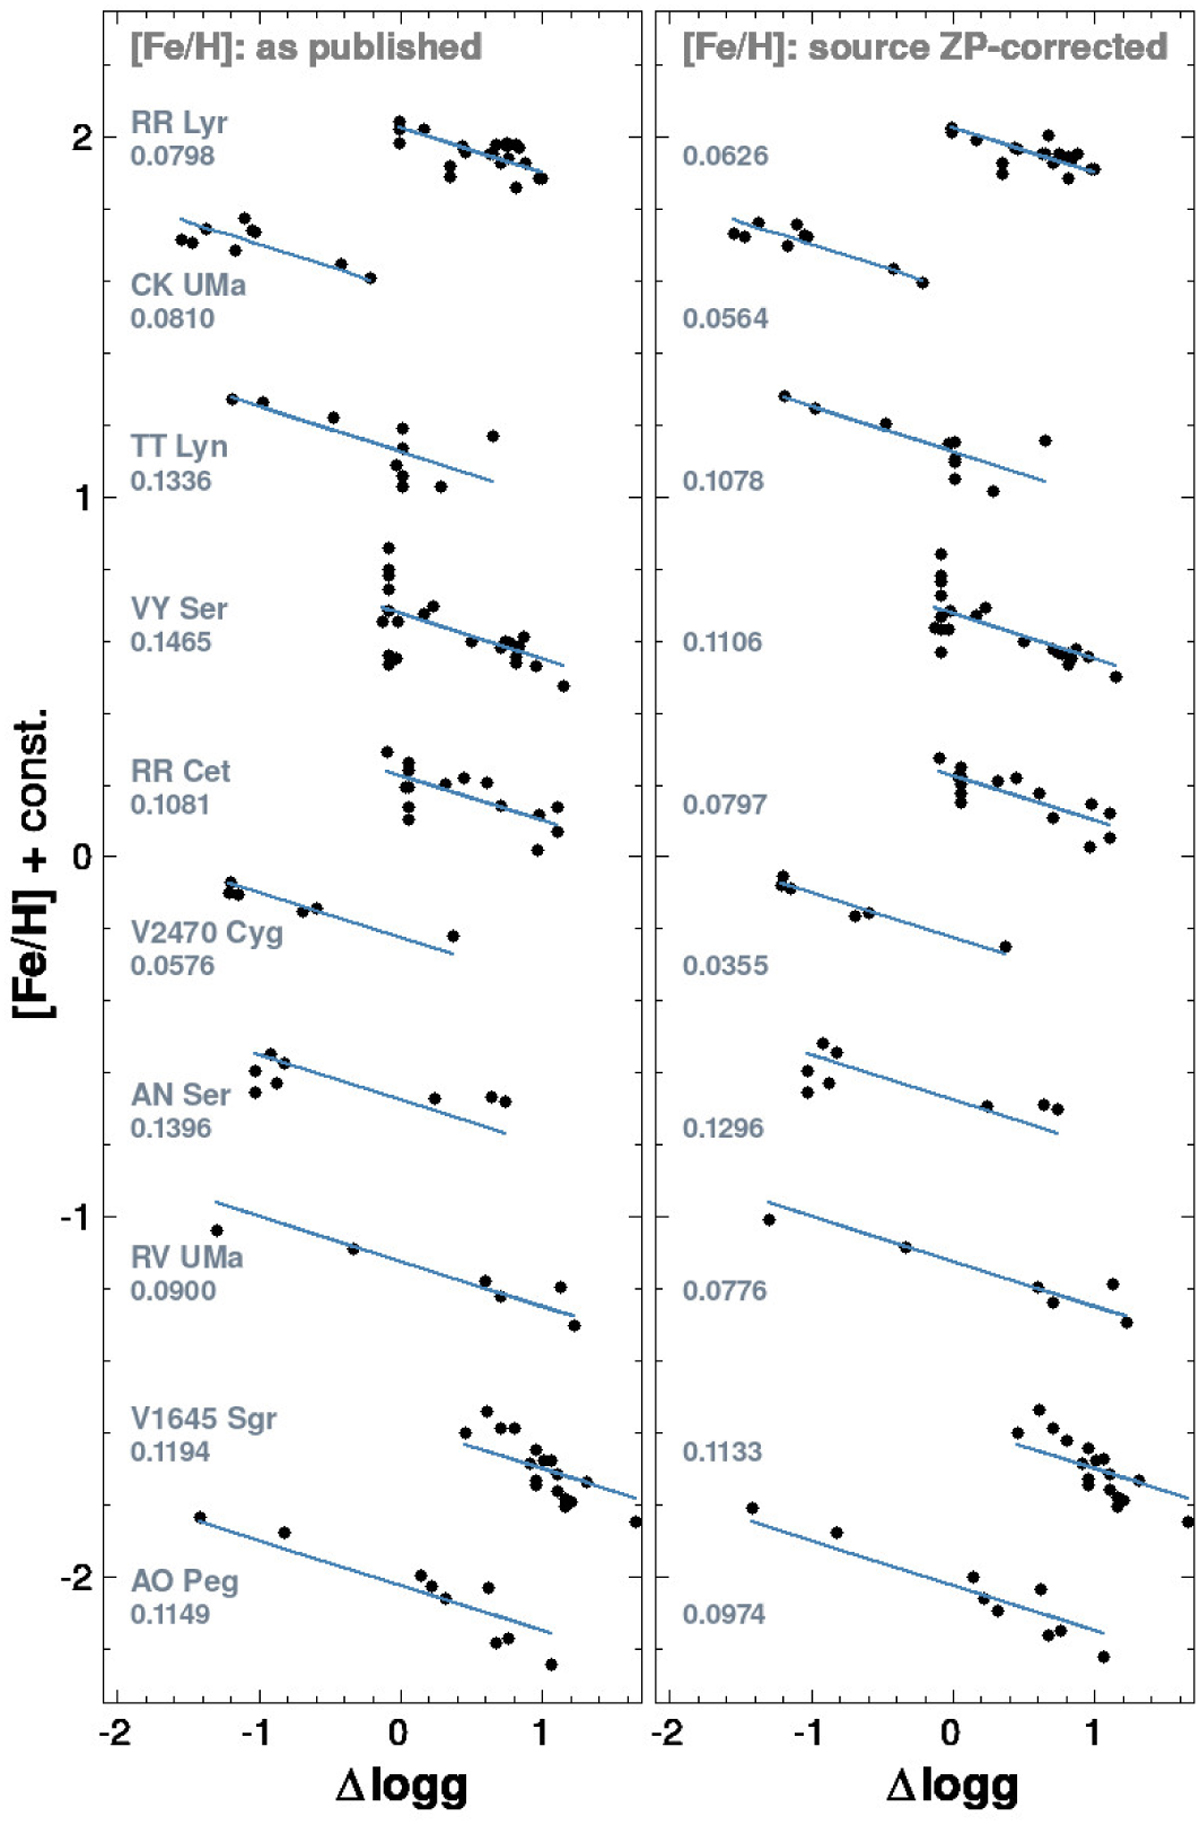
Examples of the star-by-star correlation between the gravity difference and the published abundances (left panel). The same correlation is shown in the right panel after source ZP corrections. For an easier visualization, vertical shifts were applied together with a factor of two decrease of the [Fe/H] ranges (including the slope of the fitted straight line with an original value of −0.25). Numbers at the individual objects show the RMS values around the straight lines). See text for further details.
Current usage metrics show cumulative count of Article Views (full-text article views including HTML views, PDF and ePub downloads, according to the available data) and Abstracts Views on Vision4Press platform.
Data correspond to usage on the plateform after 2015. The current usage metrics is available 48-96 hours after online publication and is updated daily on week days.
Initial download of the metrics may take a while.