Fig. 3
Download original image
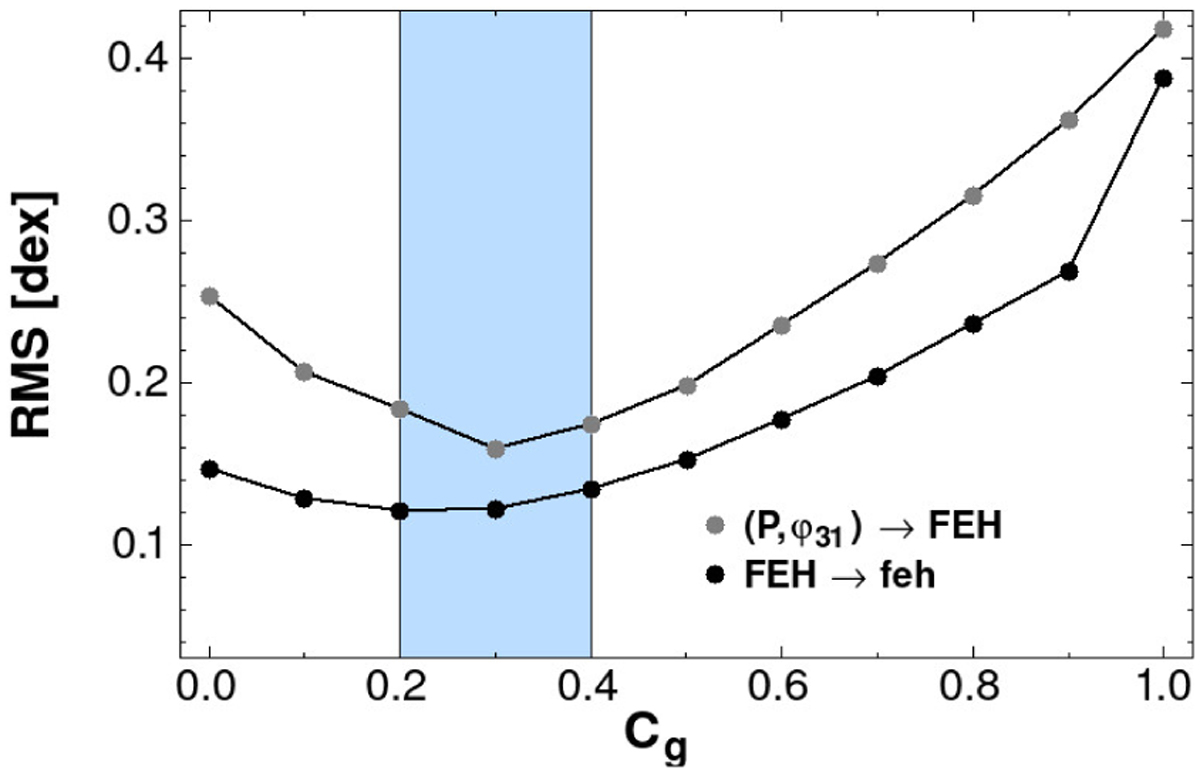
Dependence of the fit RMS values on the gravity correction factor Cg (see Eq. (1)). The plot shows the scans resulting from the direct estimates of the scatter of the individual transformed abundances {feh} around the average values {FEH} and the variation of the fit RMS of the Fourier-based estimates. The shaded box indicates the optimum regime for Cg.
Current usage metrics show cumulative count of Article Views (full-text article views including HTML views, PDF and ePub downloads, according to the available data) and Abstracts Views on Vision4Press platform.
Data correspond to usage on the plateform after 2015. The current usage metrics is available 48-96 hours after online publication and is updated daily on week days.
Initial download of the metrics may take a while.