Fig. D.1
Download original image
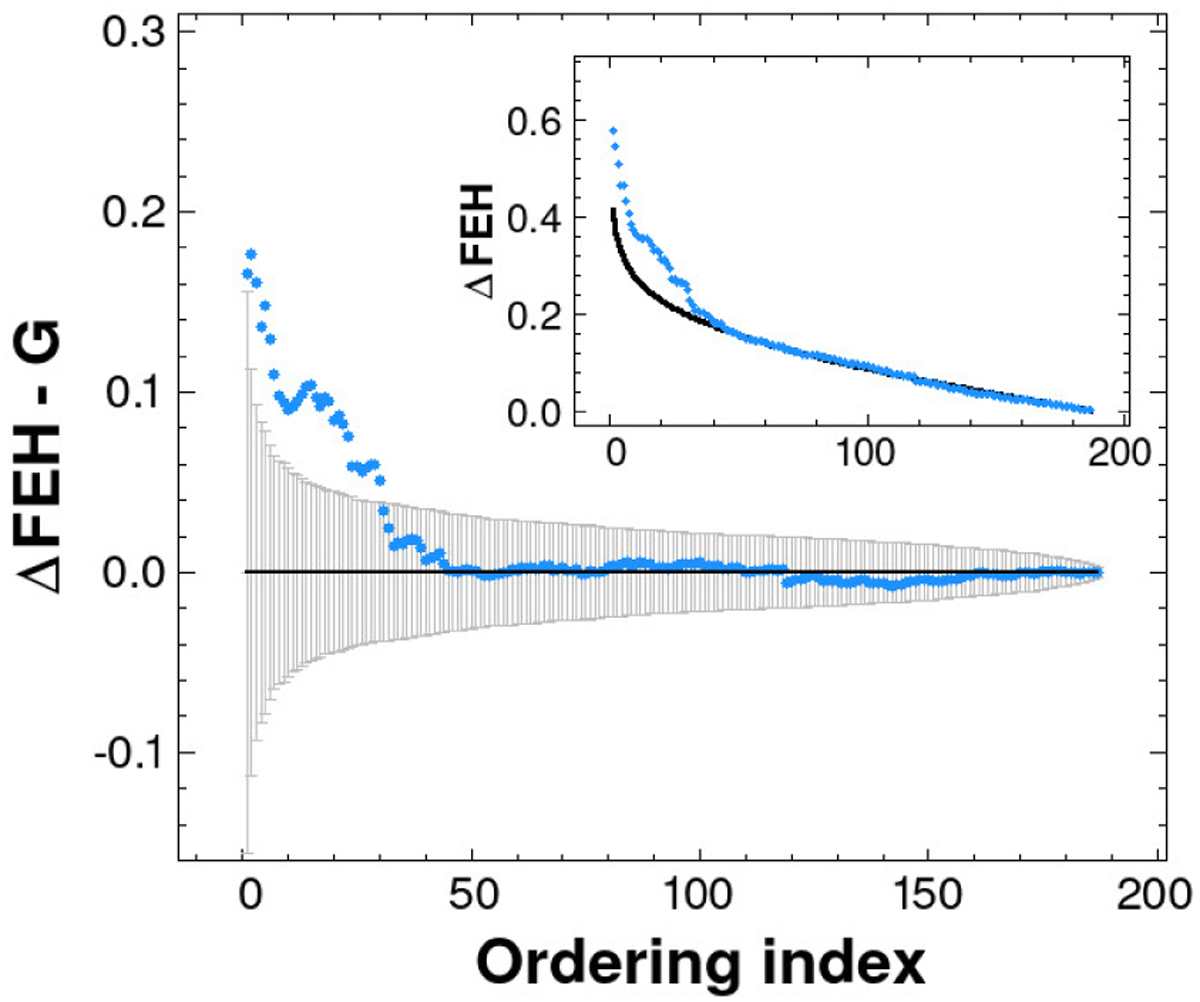
Testing the (P, φ31) → FEH fit residuals. Inset: Ordered distribution (light blue) of the residuals (ΔFEH = |FEHobs – FEHfit|) for set A of Table 3. Black line shows the distribution of the corresponding Gaussian, fitting the core of the observed residuals. Main panel: Difference between the observed and the predicted Gaussian residuals. The 3σ ranges for the Gaussian residuals are shown by the vertical error bars.
Current usage metrics show cumulative count of Article Views (full-text article views including HTML views, PDF and ePub downloads, according to the available data) and Abstracts Views on Vision4Press platform.
Data correspond to usage on the plateform after 2015. The current usage metrics is available 48-96 hours after online publication and is updated daily on week days.
Initial download of the metrics may take a while.