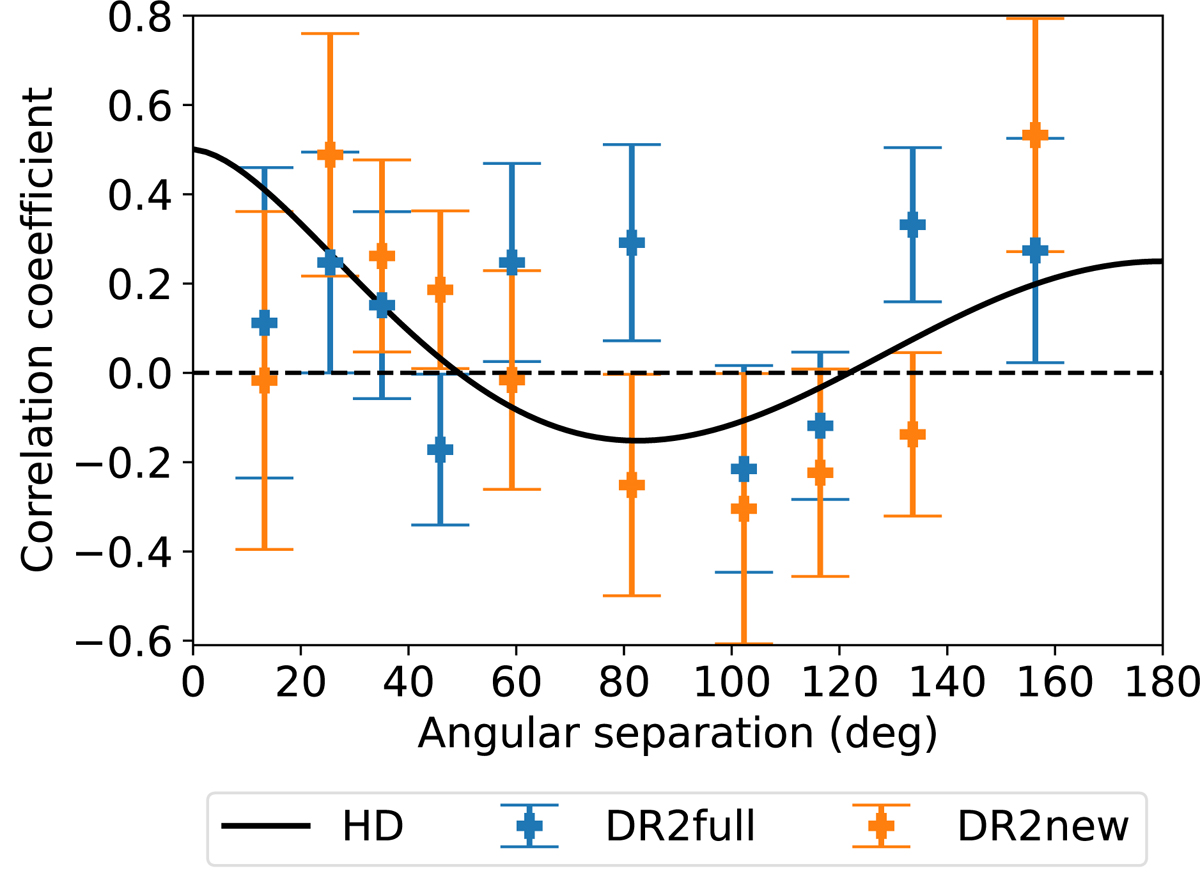
Fig. 6.
Download original image
Constraints on the overlap reduction function from the optimal statistic. Blue and orange points indicate the results for DR2full and DR2new, respectively. The correlation coefficients for each pair of pulsars are weighted and averaged following the description in Allen & Romano (2023) and grouped in the same way as those in Fig. 5 for comparison. The HD correlation is plotted as a black line for reference.
Current usage metrics show cumulative count of Article Views (full-text article views including HTML views, PDF and ePub downloads, according to the available data) and Abstracts Views on Vision4Press platform.
Data correspond to usage on the plateform after 2015. The current usage metrics is available 48-96 hours after online publication and is updated daily on week days.
Initial download of the metrics may take a while.