Fig. 3.
Download original image
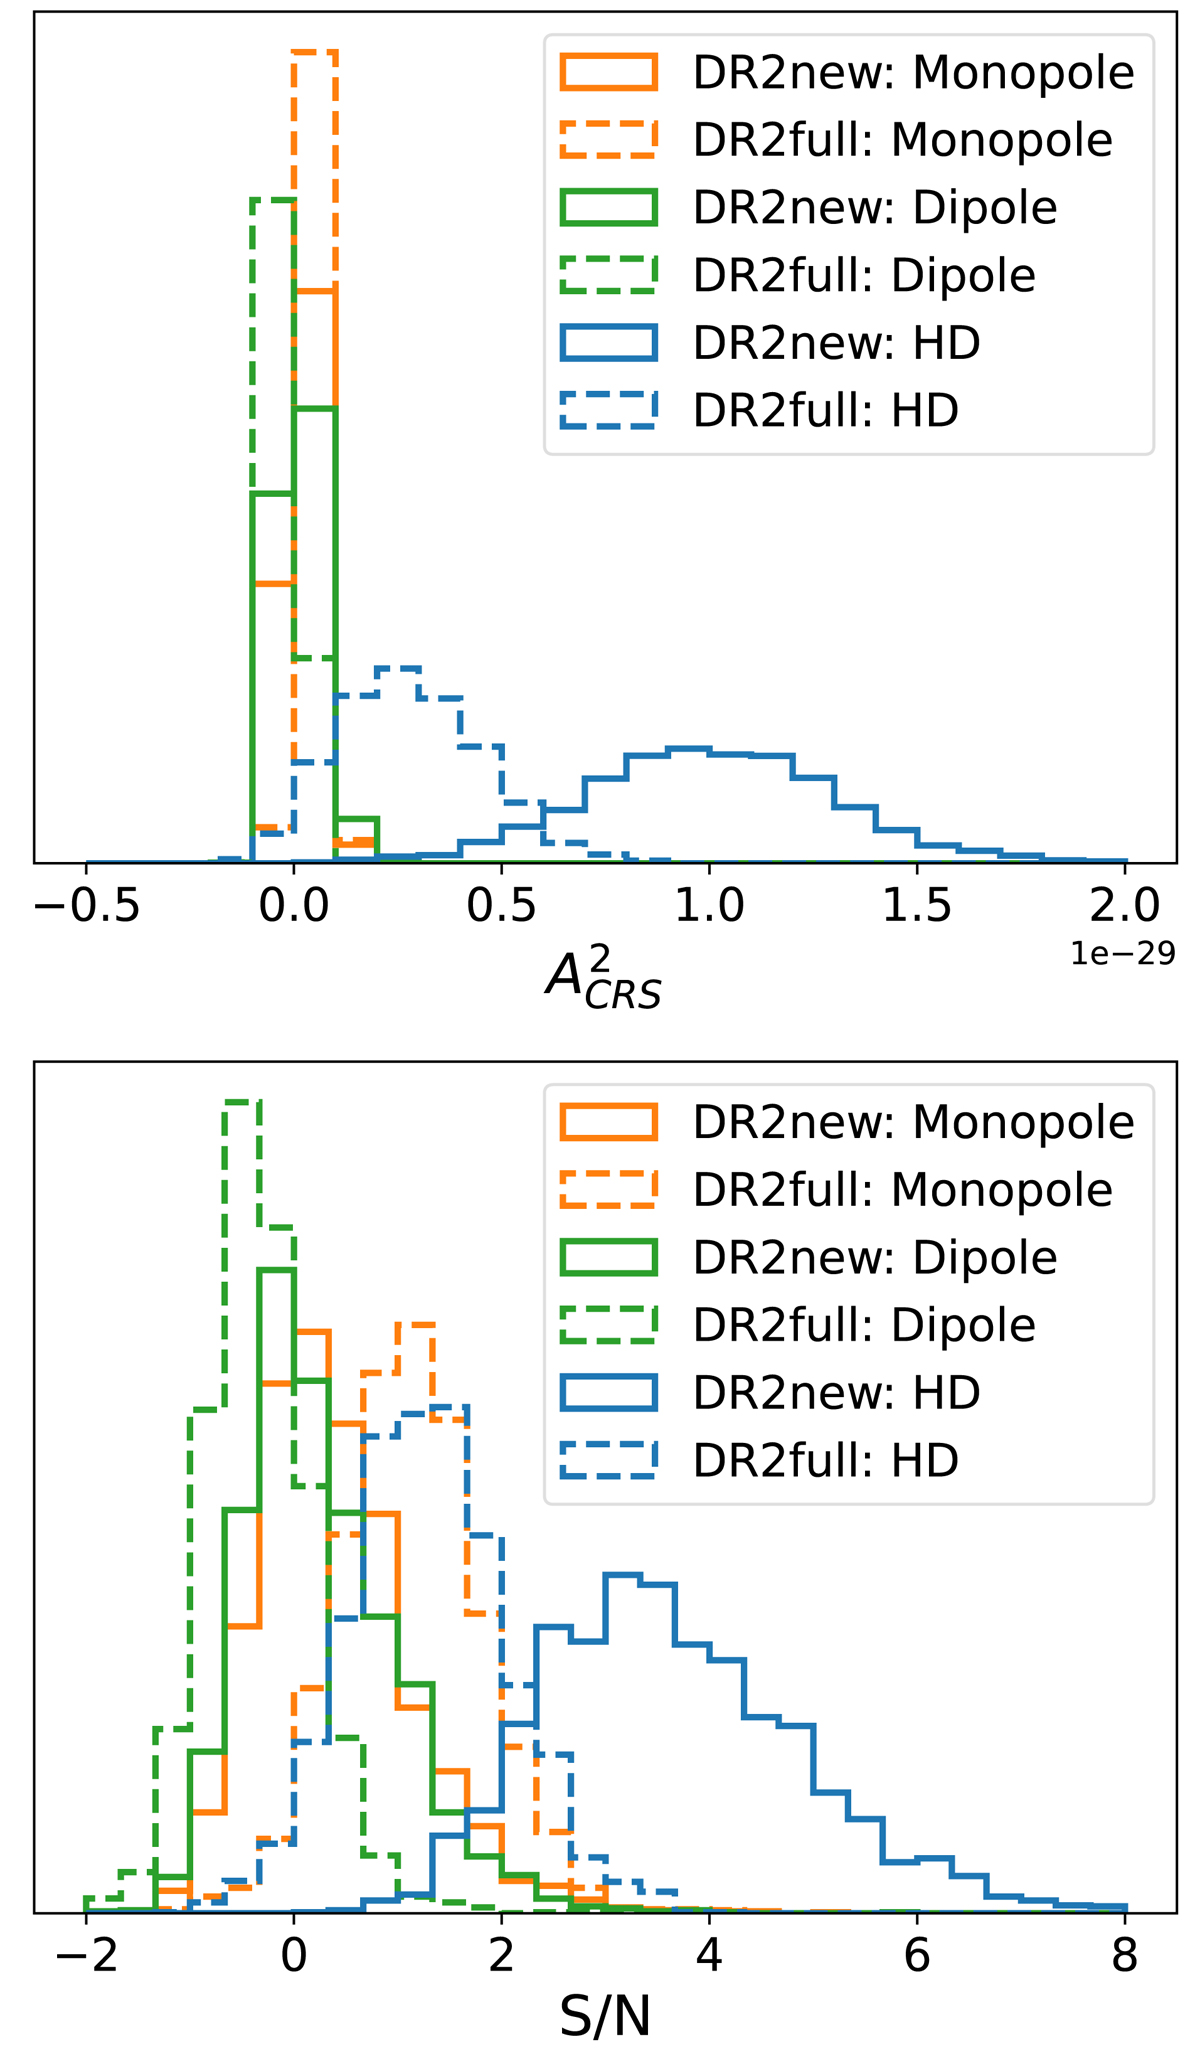
Amplitude and S/N for a common red signal with γ = 13/3 for the optimal statistic. The top and bottom panels show the noise-marginalised distributions of the squared amplitude ![]() and S/N, respectively, for a common signal with different correlation patterns, with HD in blue, monopole in orange, and dipole in green. Solid lines are results from DR2new and the dashed lines are results from DR2full.
and S/N, respectively, for a common signal with different correlation patterns, with HD in blue, monopole in orange, and dipole in green. Solid lines are results from DR2new and the dashed lines are results from DR2full.
Current usage metrics show cumulative count of Article Views (full-text article views including HTML views, PDF and ePub downloads, according to the available data) and Abstracts Views on Vision4Press platform.
Data correspond to usage on the plateform after 2015. The current usage metrics is available 48-96 hours after online publication and is updated daily on week days.
Initial download of the metrics may take a while.