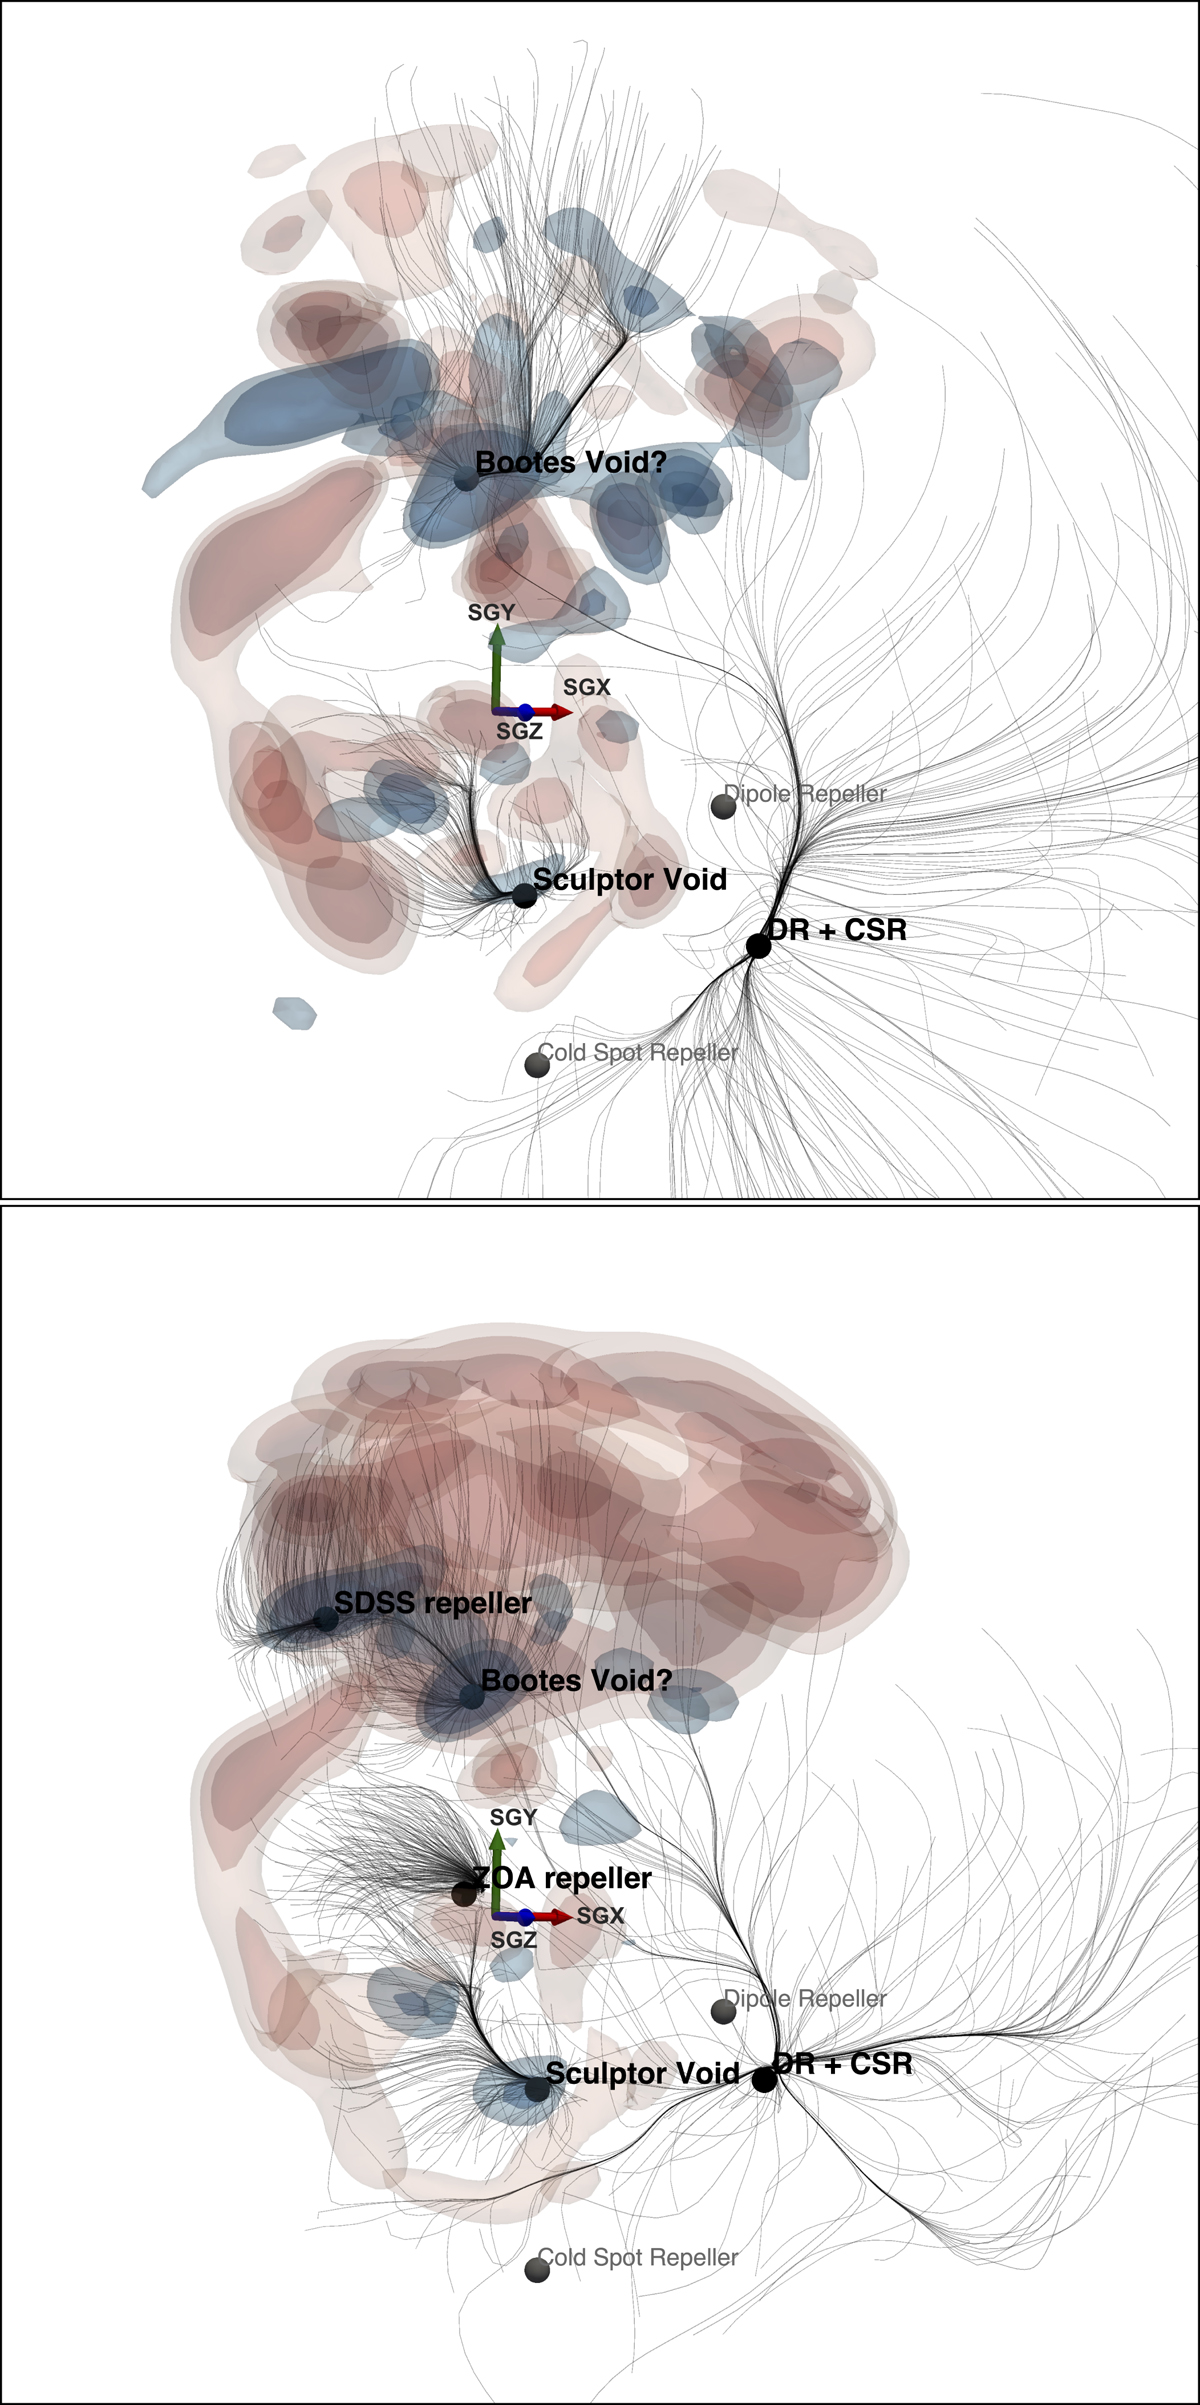
Fig. A.4.
Download original image
Repellers in the local universe reconstructed from the CF4 galaxies (top panel) and groups (bottom panel). Overdensities are represented in different red shades by three levels of isosurfaces: 1, 1.4, and 1.75 for CF4 galaxies, and 0.8, 1.2, and 1.5 for CF4 groups. Underdensities are highlighted in less transparent blue shades and represented by two levels of isosurfaces: -1.27 and -1.6 for CF4 galaxies, and -1 and -1.35 for CF4 groups. Streamlines were derived by integrating the reconstructed peculiar velocity field in the backward direction (i.e., integrating −1 × v). For the sake of clarity, extra noise has been removed by showing only streamlines part of basins of repulsion identified with the segmentation algorithm, listed in the bottom part of Table A.1. Black spheres are located at the coordinates of repellers identified in the velocity field (i.e., at the points where the streamlines converge). The center of the reconstructed cube is indicated by the red, green, and blue arrows of length 50 Mpc h−1 and directing along the supergalactic cartesian SGX, SGY, and SGZ axes, respectively. Sketchfab interactive visualizations are available for both CF4 reconstructions https://skfb.ly/oL97q and https://skfb.ly/oL978).
Current usage metrics show cumulative count of Article Views (full-text article views including HTML views, PDF and ePub downloads, according to the available data) and Abstracts Views on Vision4Press platform.
Data correspond to usage on the plateform after 2015. The current usage metrics is available 48-96 hours after online publication and is updated daily on week days.
Initial download of the metrics may take a while.