Fig. 4.
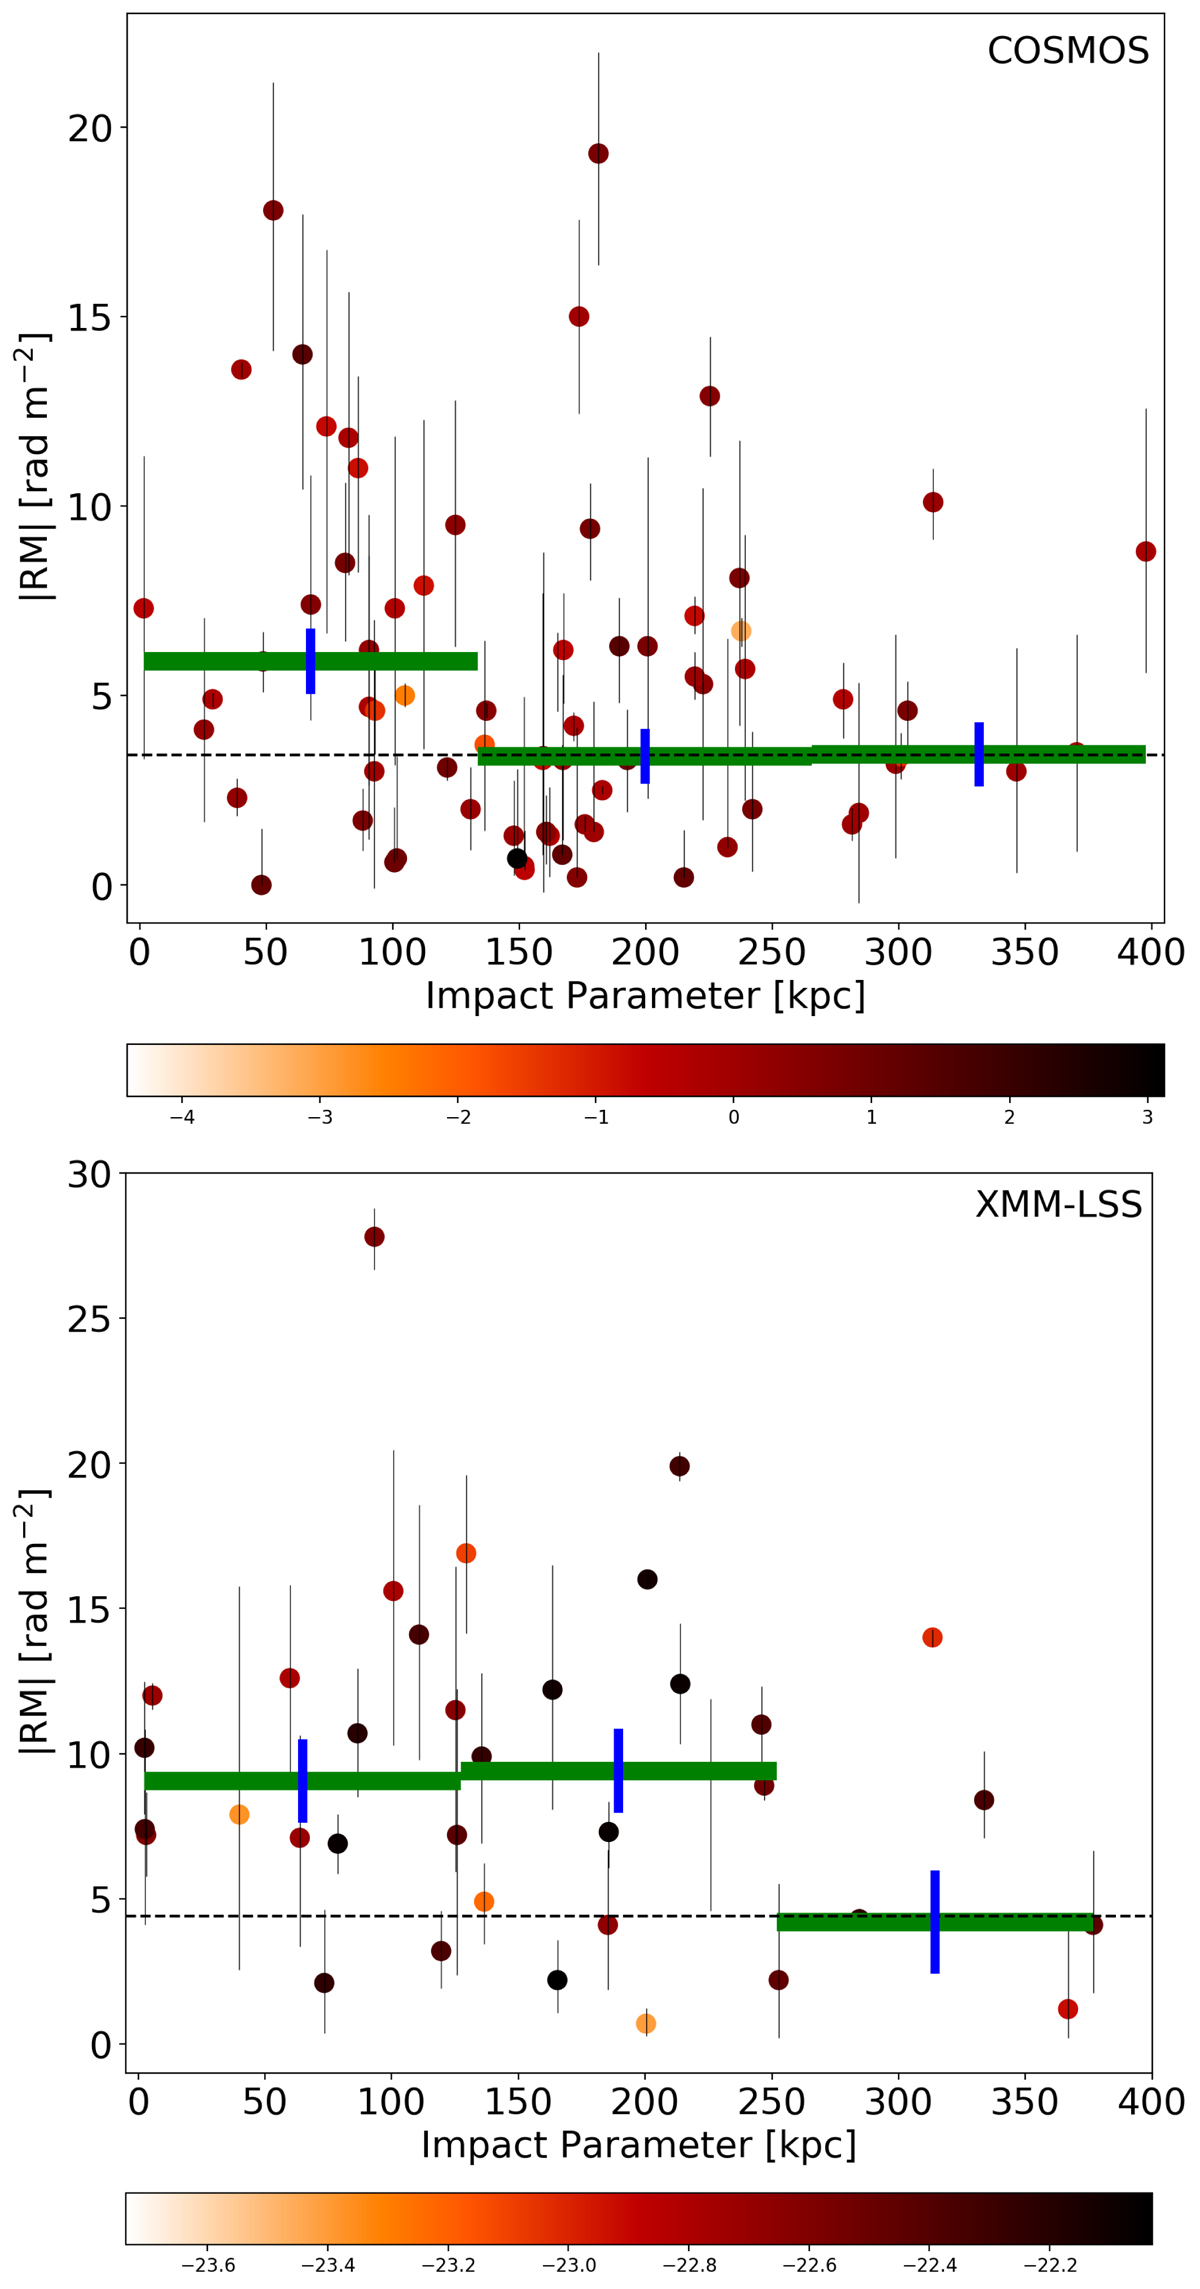
Download original image
Excess |RM| as function of impact parameter for the spectroscopic samples. Upper panel: observed |RM| in rad m−2 vs. impact parameter in kpc for all 81 sources in the COSMOS field. The green bar indicates a bin of individual data points with the blue line being the error bar. The data points are color-coded with respect to the star-formation rate of each galaxy. Lower panel: observed |RM| in rad m−2 vs. impact parameter in kpc for all 44 sources in the XMM-LSS field. Here, the data points are color-coded with respect to the u-band magnitude of each galaxy. For both fields all error bars show the 68% interval around |RM|.
Current usage metrics show cumulative count of Article Views (full-text article views including HTML views, PDF and ePub downloads, according to the available data) and Abstracts Views on Vision4Press platform.
Data correspond to usage on the plateform after 2015. The current usage metrics is available 48-96 hours after online publication and is updated daily on week days.
Initial download of the metrics may take a while.