Open Access
Fig. 3.
Download original image
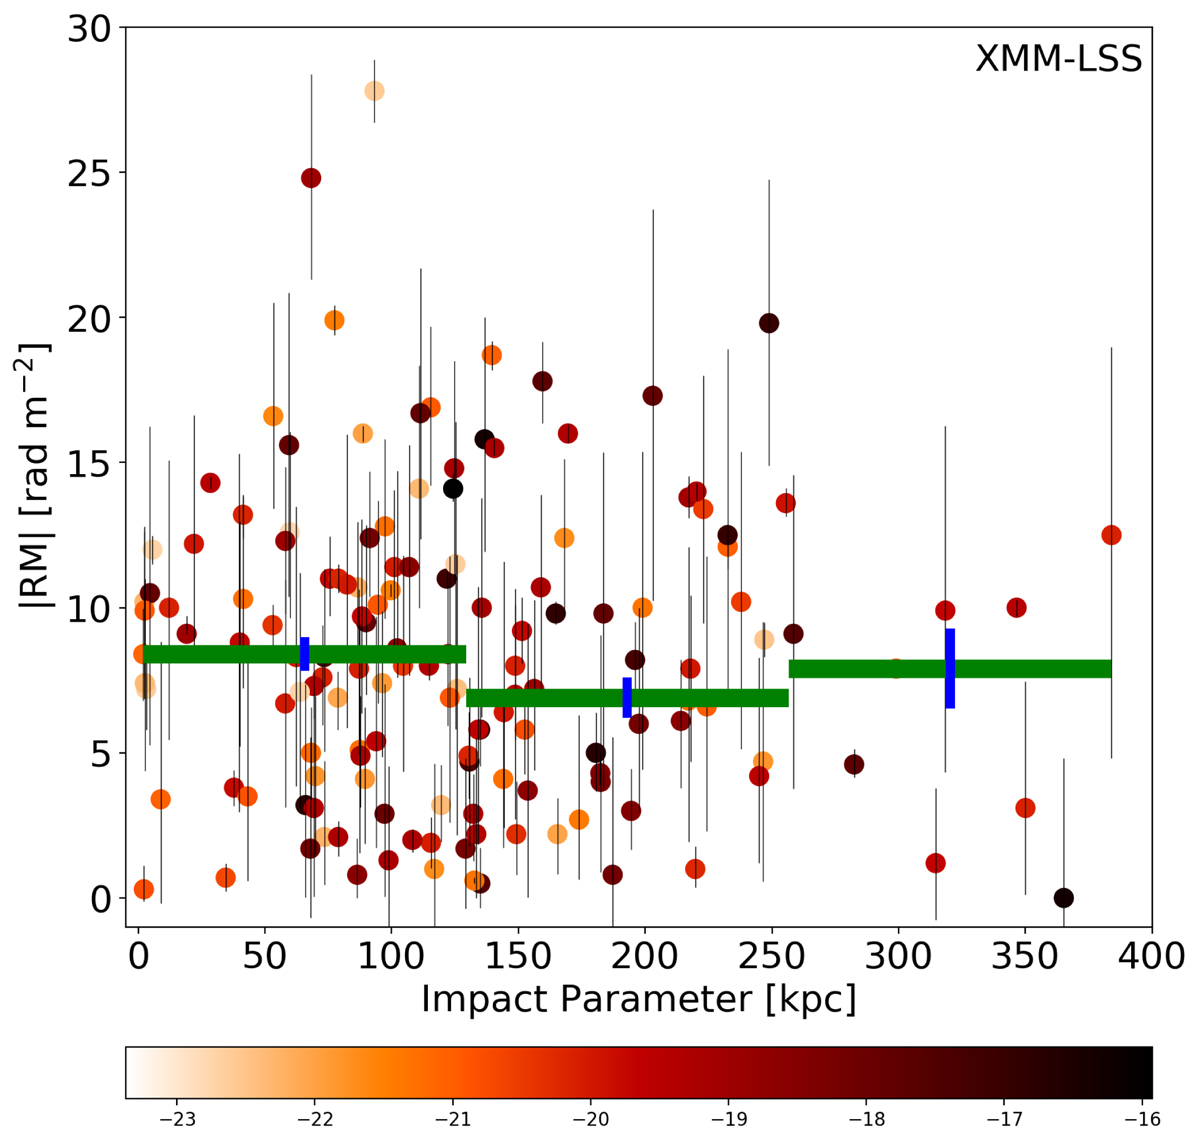
Observed |RM| in rad m−2 vs. impact parameter in kpc for the XMM-LSS without the magnitude cut. The green bar indicates a bin of individual data points with the blue line being the error bar of the bin. The individual data points are color-coded with their corresponding u-band magnitude.
Current usage metrics show cumulative count of Article Views (full-text article views including HTML views, PDF and ePub downloads, according to the available data) and Abstracts Views on Vision4Press platform.
Data correspond to usage on the plateform after 2015. The current usage metrics is available 48-96 hours after online publication and is updated daily on week days.
Initial download of the metrics may take a while.