Fig. 9
Download original image
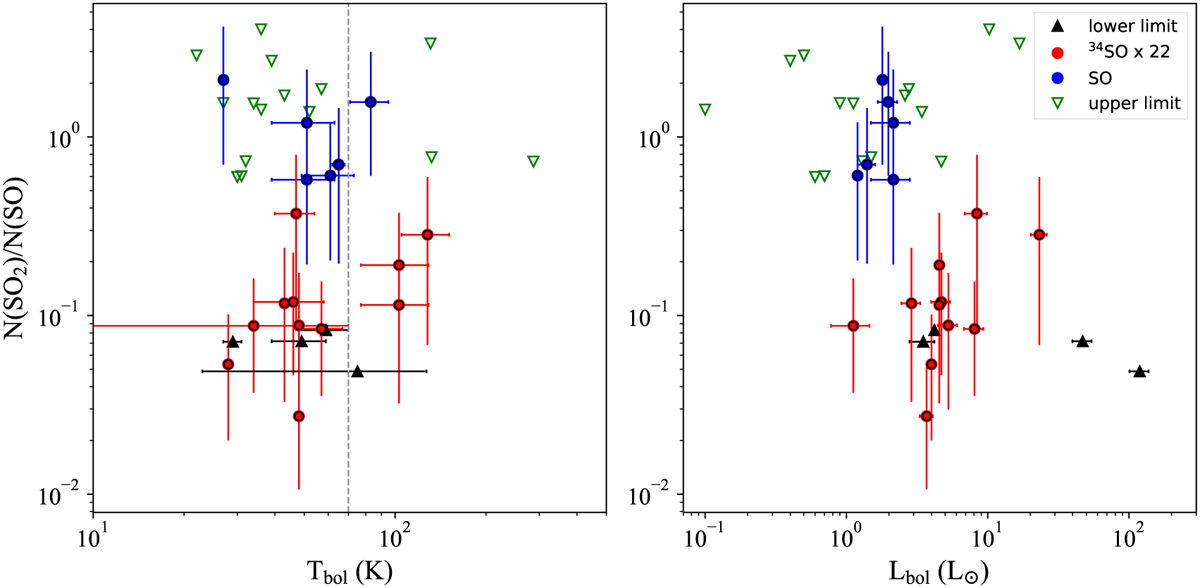
Column density ratio between SO2 and SO as a function of Tbol (left) and Lbol (right). Red dots are values calculated from 34SO fluxes and later on multiplied by 22 (Wilson 1999), while blue dots indicate those sources where34 SO is not detected and the ratios are calculated from the SO 66−55 transition. Black triangles represent lower limits (optically thick SO2 emission) and green triangles indicate upper limits, given by those sources where SO emission is detected but SO2 is not. The gray dashed line in the left panel represents Tbol = 70, the separation between Class 0 and Class I sources. Error bars in the y-axis represent ranges for Tех between 50 and 150 K.
Current usage metrics show cumulative count of Article Views (full-text article views including HTML views, PDF and ePub downloads, according to the available data) and Abstracts Views on Vision4Press platform.
Data correspond to usage on the plateform after 2015. The current usage metrics is available 48-96 hours after online publication and is updated daily on week days.
Initial download of the metrics may take a while.