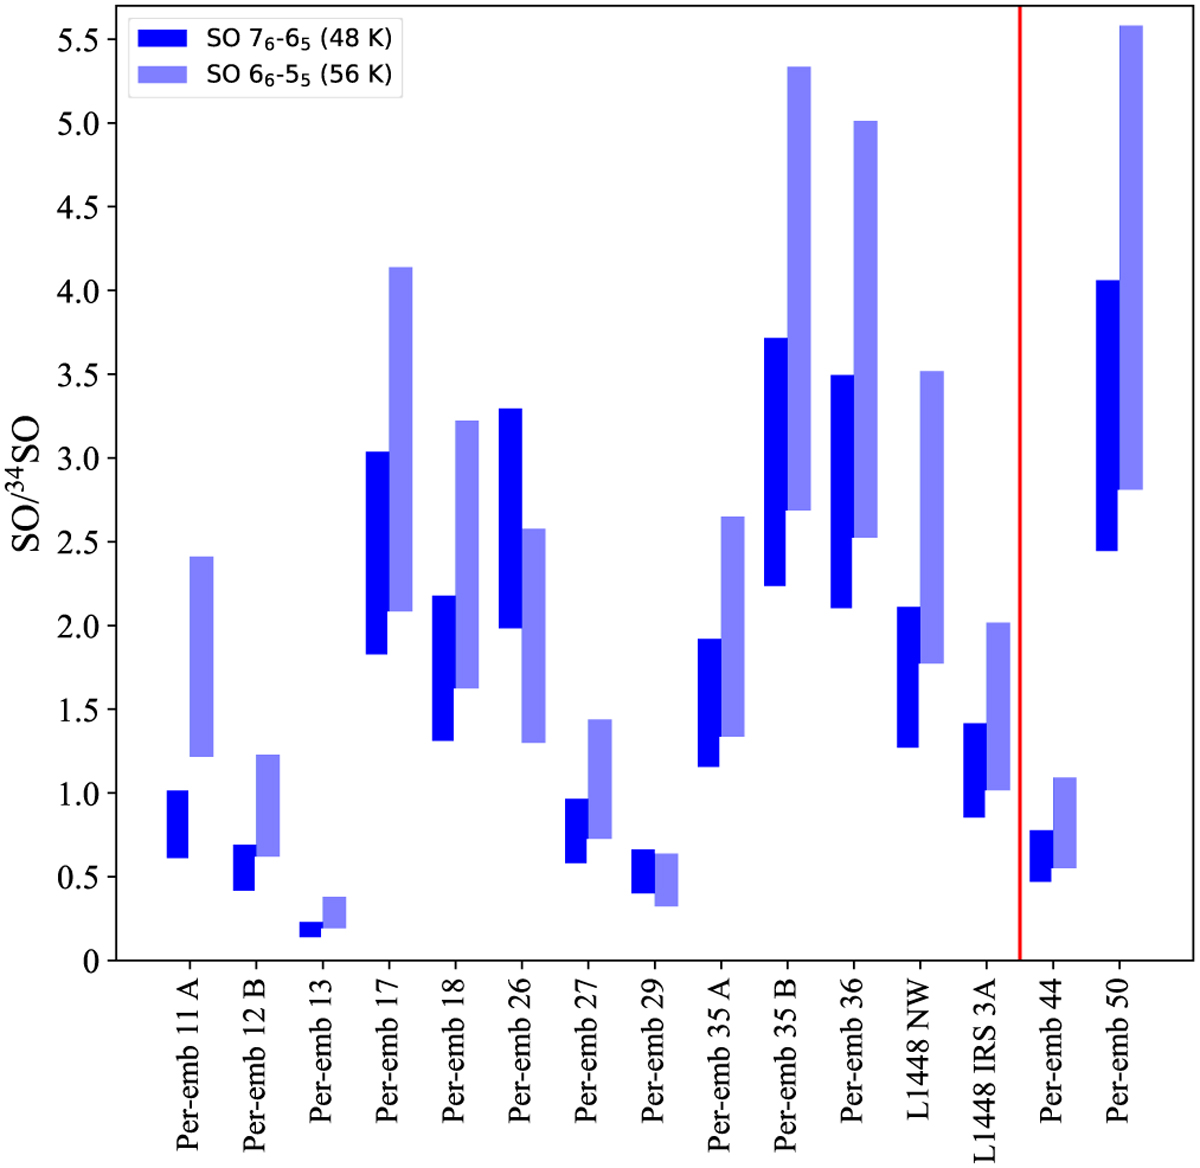
Fig. 8
Download original image
Molecular column density ratio of SO over 34SO, showing that both SO transitions are optically thick. A range of Tex, between 50 and 150 K has been employed for the calculations. Dark blue and light blue bars indicate ratios calculated from SO 76−65 and SO 66−55, respectively. The red vertical line separates Class 0 (left) from Class I sources (right).
Current usage metrics show cumulative count of Article Views (full-text article views including HTML views, PDF and ePub downloads, according to the available data) and Abstracts Views on Vision4Press platform.
Data correspond to usage on the plateform after 2015. The current usage metrics is available 48-96 hours after online publication and is updated daily on week days.
Initial download of the metrics may take a while.