Fig. 7
Download original image
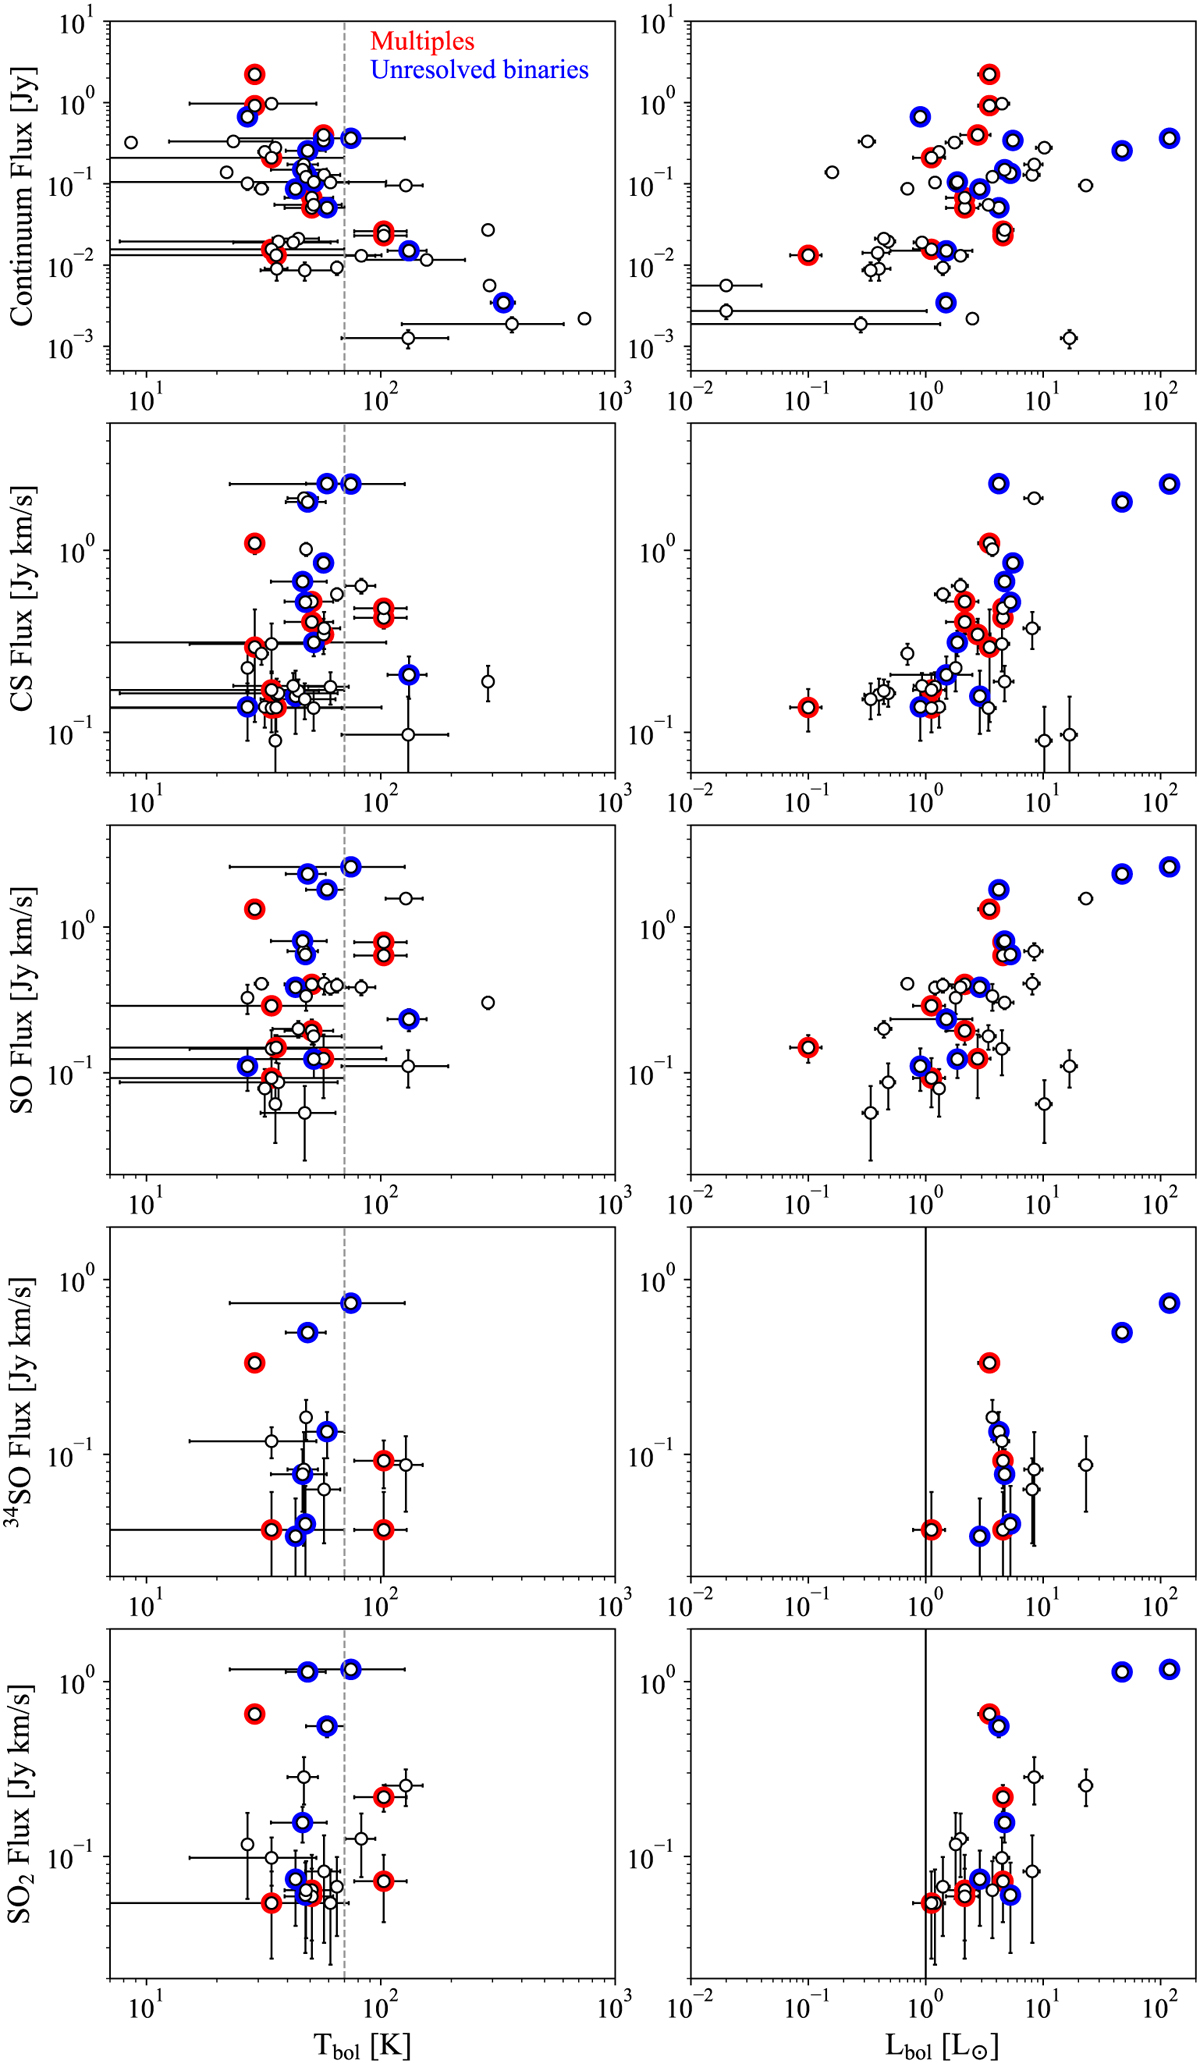
Continuum and molecular fluxes (above 3σ) as a function of Tbol (left) and Lbol (right). The gray dashed line represents Tbol = 70, the separation between Class 0 and Class I sources, while the black solid line in the last two panels of the right column indicates Lbol = 1 L⊙. Red circles represent multiple systems (binaries or triples) where the continuum ALMA emission is resolved but they do not have individual Tbol and Lbol measurements from far IR. Blue circles indicate unresolved binaries in continuum ALMA emission.
Current usage metrics show cumulative count of Article Views (full-text article views including HTML views, PDF and ePub downloads, according to the available data) and Abstracts Views on Vision4Press platform.
Data correspond to usage on the plateform after 2015. The current usage metrics is available 48-96 hours after online publication and is updated daily on week days.
Initial download of the metrics may take a while.